# JMX Querier plugin # Introduction **Ver**. 19-06-2024 This document describes the functionality of the JMX plugin and its integration with PandoraFMS. The JMX plugin allows the integration of Mbeans statistics in PandoraFMS. **Tipo**: Plug-in server # Compatibility matrix
**Systems where tested**Rocky linux, Fedora
**Systems where it works**Any linux system
# Pre requisites **1. Enabling Remote JMX Monitoring for Java Applications** A Java application does not require additional software installed, but it must be started with the following command line options to enable support for remote JMX monitoring. At the very least, if you only want to start monitoring a basic Java application on a local host without security, use these options: ``` -Dcom.sun.management.jmxremote \ -Dcom.sun.management.jmxremote.authenticate=false \ -Dcom.sun.management.jmxremote.ssl=false \ -Dcom.sun.management.jmxremote.port=9090 \ -Dcom.sun.management.jmxremote.rmi.port=9090 \ -Djava.rmi.server.hostname=localhost" ``` This configures Java to accept incoming JMX connections on port 9090 from localhost only, with no authentication or SSL required. If authentication is required, it must be enabled: ``` -Dcom.sun.management.jmxremote \ -Dcom.sun.management.jmxremote.authenticate=true \ -Dcom.sun.management.jmxremote.ssl=false \ -Dcom.sun.management.jmxremote.port=9090 \ -Dcom.sun.management.jmxremote.rmi.port=9090 \ -Djava.rmi.server.hostname=localhost \ -Dcom.sun.management.jmxremote.password.file=/usr/local/tomcat/conf/jmxremote.password \ -Dcom.sun.management.jmxremote.access.file=/usr/local/tomcat/conf/jmxremote.access ``` **2. The system running the plugin must have connectivity and be able to reach the JMX server.** # Parameters **JMX connection and configuration parameters**
**--jmx\_url**JMX server connection endpoint, example : service:jmx:rmi:///jndi/rmi://localhost:9090/jmxrmi
**--list\_mbeans**Using this parameter, you can list all the Mbeans available on the JMX server. It is set to 1.
**--list\_attr**Using this parameter you can list all the available attributes of a Mbean, passing the mbean to it. Example: "java.lang:name=G1 Old Generation,type=GarbageCollector".
**--conf**File with the metrics that the plugin will monitor.
**--user**JMX server user if necessary to authenticate.
**--password**JMX server password if needed for authentication.

The use of --list\_mbeans, --list\_attr and conf parameters to discover and integrate statistics is described in more detail in the chapter: "Discovering statistics and integrating them in the execution".

**Parámetros configuración Pandora**
**--agent\_name** Name of the agent that will contain all the statistics modules
**--module\_prefix**Prefix for all modules created by the plugin
**--interval**Agent monitoring interval
**--data\_dir** PandoraFMS Data Directory
**--group**Group in PandoraFMS
**--transfer\_mode** Data transfer mode, local or tentacle
**--tentacle\_port** Tentacle Port
**--tentacle\_address** Tentacle IP
**Parámetros extra**
--log\_fileLog file path
# Manual execution The plugin execution format is as follows : ``` /jmx_querier --jmx_url < jmx url endpoint > \. [--list_mbeans < 1 or 0 >] \ [--list_attr < mbean name >]]. [--conf < path to conf file with stats >]] --user < jmx server user >]] \ [--user < jmx server user >] \ --password < jmx server password >]] \ [--password < jmx server password >] \ --agent_name < agent's name >]] \ [--module_prefix < agent's name >] \ [--module_prefix < prefix for modules >] \] \ [--group ] \ --interval ] \ [--interval ] \ --temporal ] \ [--data_dir ] \ [--data_dir ] \] [--transfer_mode ] \ --transfer_mode ] \ [--transfer_mode ] \ [--tentacle_port ] \ [--tentacle_port ] \ [--tentacle_address ] \ [--log_file ] \ [--log_file ] \ [--log_file ] ``` For example: ``` ./jmx_querier --jmx_url "service:jmx:rmi:///jndi/rmi://localhost:9090/jmxrmi" --conf jmx.conf --user "controlRole" --password "myPassword" ``` # Discovering statistics and integrating them into execution The plugin has two discovery parameters, which will allow us to discover statistics, which can then be incorporated in a conf file, to monitor them. **--list\_mbeans** This parameter allows us to list all the mbeans on our server, e.g. : [![image.png](https://pandorafms.com/guides/public/uploads/images/gallery/2024-06/scaled-1680-/Nw6image.png)](https://pandorafms.com/guides/public/uploads/images/gallery/2024-06/Nw6image.png) **--list\_attr** If this parameter is used, with the name of one of the mbeans listed by the plugin, it will list all the attributes of the mbean, i.e. each statistic, which can then be defined in conf [![image.png](https://pandorafms.com/guides/public/uploads/images/gallery/2024-06/scaled-1680-/J0Pimage.png)](https://pandorafms.com/guides/public/uploads/images/gallery/2024-06/J0Pimage.png) # Configuration in PandoraFMS To configure the plugin in PandoraFMS, the following steps must be followed: **1. Upload the plugin to PandoraFMS, for example in the following path:** ``` /usr/share/pandora_server/util/plugin ``` **2. Go to the plugins section and create a new one:** [![imagen.png](https://pandorafms.com/guides/public/uploads/images/gallery/2024-01/scaled-1680-/VNOimagen.png)](https://pandorafms.com/guides/public/uploads/images/gallery/2024-01/VNOimagen.png) **3. Name, description and timeout are added:** [![image.png](https://pandorafms.com/guides/public/uploads/images/gallery/2024-06/scaled-1680-/zozimage.png)](https://pandorafms.com/guides/public/uploads/images/gallery/2024-06/zozimage.png) **4. The path of the plugin is added to the command and the necessary parameters for its execution.**

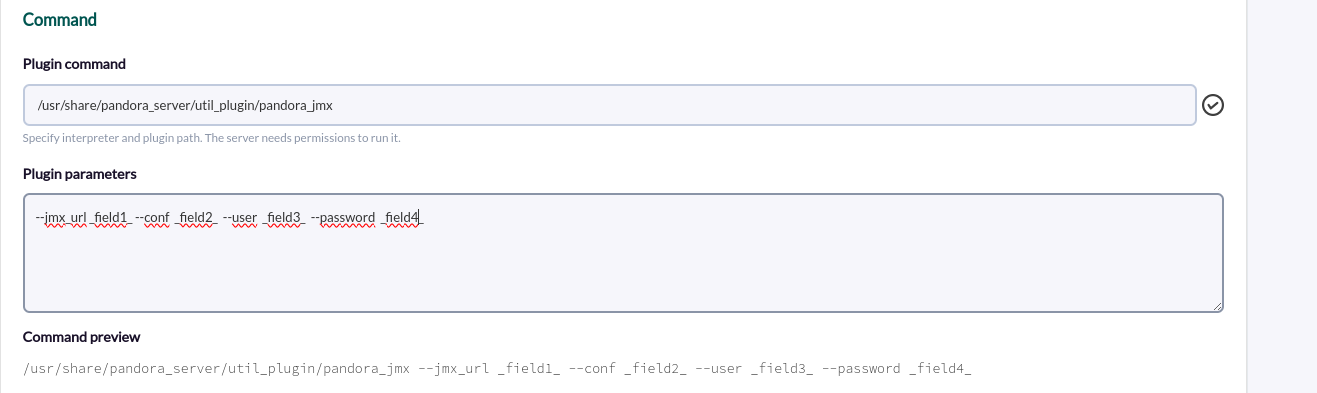
For each parameter a macro must be configured, the syntax of this macro being the following : \_fieldx\_, where x is the positional number of the parameter.

[![image.png](https://pandorafms.com/guides/public/uploads/images/gallery/2024-06/scaled-1680-/sztimage.png)](https://pandorafms.com/guides/public/uploads/images/gallery/2024-06/sztimage.png) **5. The previous macros are configured, adding the value of the parameter in each one:** [![image.png](https://pandorafms.com/guides/public/uploads/images/gallery/2024-06/scaled-1680-/RMBimage.png)
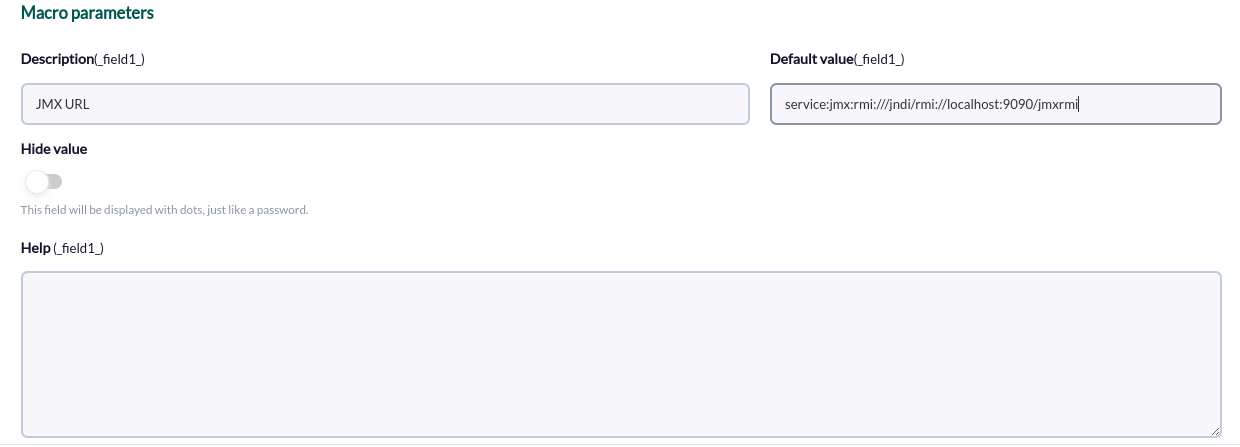
](https://pandorafms.com/guides/public/uploads/images/gallery/2024-06/RMBimage.png) **6.** **Once configured, you should create a module in an agent that executes the plugin. In the modules menu of an agent we create a new plugin type module:** [![imagen.png](https://pandorafms.com/guides/public/uploads/images/gallery/2024-01/scaled-1680-/503imagen.png)
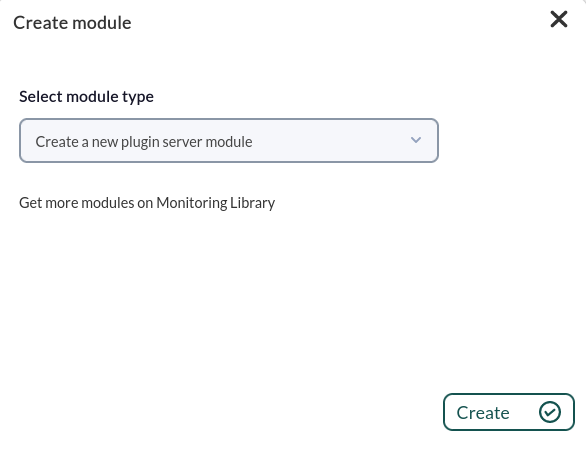
](https://pandorafms.com/guides/public/uploads/images/gallery/2024-01/503imagen.png) **7. In the module configuration menu, we name it, select the plugin configured before and click on "create".** [![image.png](https://pandorafms.com/guides/public/uploads/images/gallery/2024-06/scaled-1680-/pheimage.png)
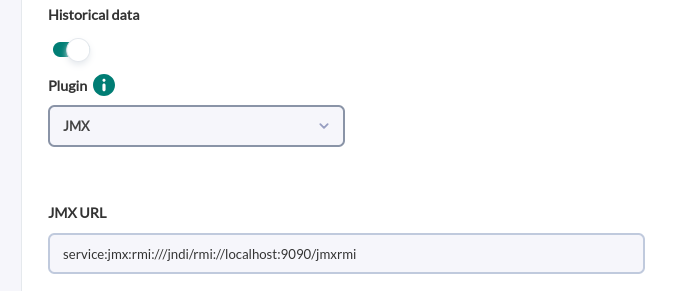
](https://pandorafms.com/guides/public/uploads/images/gallery/2024-06/pheimage.png) **8. The agent will be created with the modules or the modules in the selected agent in the next execution of the plugin.** # Agent and modules generated by the plugin The plugin will create an agent, with the name given by the --agent\_name parameter (or JMX by default) that will contain the modules of each statistic defined in the configuration file. So, for example, the execution of this plugin against the following conf: ``` java.lang:type=Threading/TotalThreadAllocatedBytes java.lang:type=Threading/CurrentThreadAllocatedBytes java.lang:type=Threading/ThreadAllocatedMemoryEnabled java.lang:type=Threading/ThreadAllocatedMemorySupported java.lang:type=Threading/ThreadCount java.lang:type=Threading/TotalStartedThreadCount java.lang:type=Threading/AllThreadIds java.lang:type=Threading/CurrentThreadCpuTime java.lang:type=Threading/CurrentThreadUserTime java.lang:type=Threading/ThreadCpuTimeSupported java.lang:type=Threading/ThreadCpuTimeEnabled java.lang:type=Threading/ThreadContentionMonitoringEnabled java.lang:type=Threading/ThreadContentionMonitoringSupported java.lang:type=Threading/CurrentThreadCpuTimeSupported java.lang:type=Threading/ObjectMonitorUsageSupported java.lang:type=Threading/SynchronizerUsageSupported java.lang:type=Threading/PeakThreadCount java.lang:type=Threading/DaemonThreadCount java.lang:type=Threading/ObjectName ``` I would create the following modules : [![image.png](https://pandorafms.com/guides/public/uploads/images/gallery/2024-06/scaled-1680-/Afqimage.png)
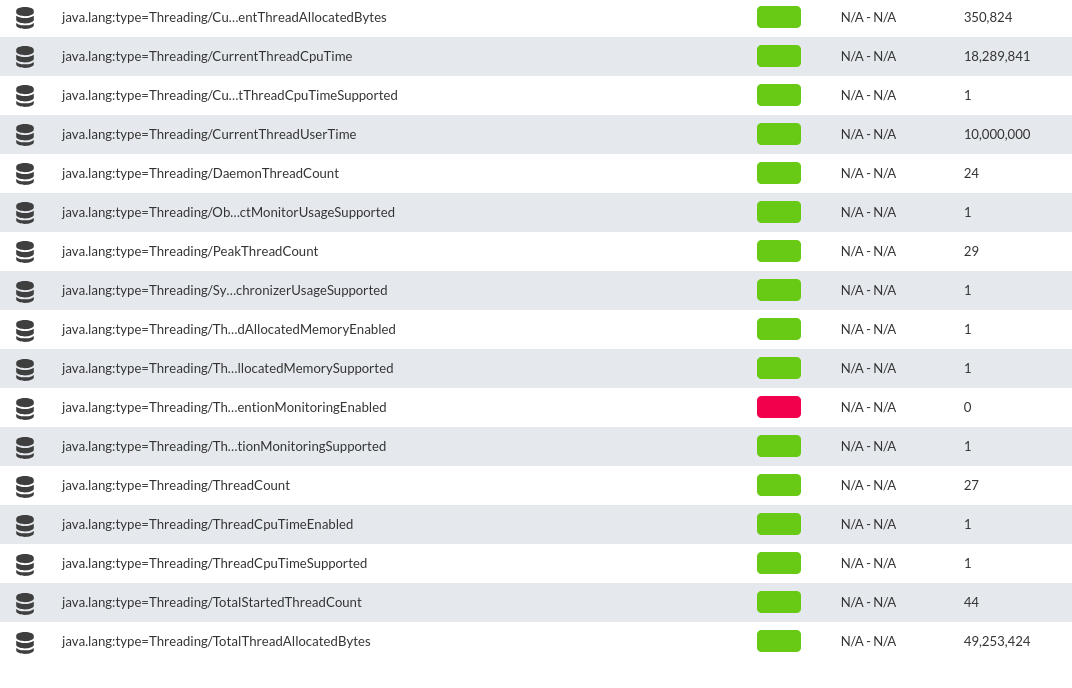
](https://pandorafms.com/guides/public/uploads/images/gallery/2024-06/Afqimage.png) # Defining statistics and thresholds in the configuration file The statistics (attributes) discovered, can be copied in a configuration file, in which thresholds can also be defined. For each line in the configuration file an attribute must be added and this will create a module with that statistic in Pandora. If thresholds need to be configured, they must be specified to the right of the attribute, each threshold separated by |. Example: **Metric without threshold** java.lang:type=Threading/ThreadCount [![image.png](https://pandorafms.com/guides/public/uploads/images/gallery/2024-06/scaled-1680-/b2mimage.png)](https://pandorafms.com/guides/public/uploads/images/gallery/2024-06/b2mimage.png) **Metric with threshold** java.lang:type=Threading/TotalStartedThreadCount|min\_warning 30|min\_critical 45 [![image.png](https://pandorafms.com/guides/public/uploads/images/gallery/2024-06/scaled-1680-/p0Jimage.png)](https://pandorafms.com/guides/public/uploads/images/gallery/2024-06/p0Jimage.png)