# Horizon VMware Discovery
# Introduction
This plugin is used to monitor VMware Horizon environments through calls to its REST API, collecting detailed information about the status of desktop pools, RDS servers, active sessions, licenses, system metrics and other key elements of the infrastructure. Through multiple predefined endpoints, the script extracts data about the operation and performance of the platform, allowing to identify potential bottlenecks or service failures.
The system authenticates through configurable credentials, queries the enabled endpoints according to the permissions assigned to the user, and transforms the information collected into agents and modules in XML format. This data is automatically sent to the Pandora FMS server using the Tentacle transfer mode, facilitating the distributed monitoring of the Horizon platform. In addition, the plugin is prepared to manage multiple resources in parallel and scale as needed, providing a flexible and automated solution for monitoring enterprise Horizon environments.
# Prerrequisites
- The system running the plugin must have connectivity and be able to remotely reach the Horizon environment.
- The following roles and privileges are required:
```
FEDERATED_LDAP_VIEW
FEDERATED_SESSIONS_VIEW
GLOBAL_CONFIG_VIEW
MACHINE_VIEW
POOL_VIEW
UDD_VIEW
VC_CONFIG_VIEW
```
# Parameters
**Parámeters**
--conf
Conf file path
**Configuration file (--conf)**
```
domain = < domain name >
username = < user name >
password = < user password >
url = < url of the environment >
interval = < agent creation interval >
temporal = < temporary file path >
transfer_mode = < transfer mode >
tentacle_ip = < tentacle ip address >
tentacle_port = < ptentacle port >
data_dir = < .data path of the agents >
```
**Example**
```
user = "admin"
password = "P@ssw0rd123"
domain = "CORP"
url = "https://horizon.example.com"
interval = 300
temporal = /tmp
transfer_mode = tentacle
tentacle_ip =172.42.42.101
tentacle_port =41121
data_dir = /var/spool/pandora/data_in/
```
# Manual execution
The format of the plugin execution is as follows:
```
./pandora_horizon --conf < ruta al fichero de configuración >
```
Example:
```
./pandora_horizon --conf /usr/share/pandora_server/util/plugin/horizon.conf
```
The execution will return an output in JSON format with information about the execution, and will generate an XML file for each monitored agent that will be sent to the Pandora FMS server by the transfer method indicated in the configuration.
# Discovery
This plugin can be integrated with Pandora FMS Discovery.
To do so, you must load the “.disco” package that you can download from the Pandora FMS library:
[https://pandorafms.com/library/](https://pandorafms.com/library/)
Once loaded, Horizon environments can be monitored by creating Discovery tasks from the Management > Discovery > App section.
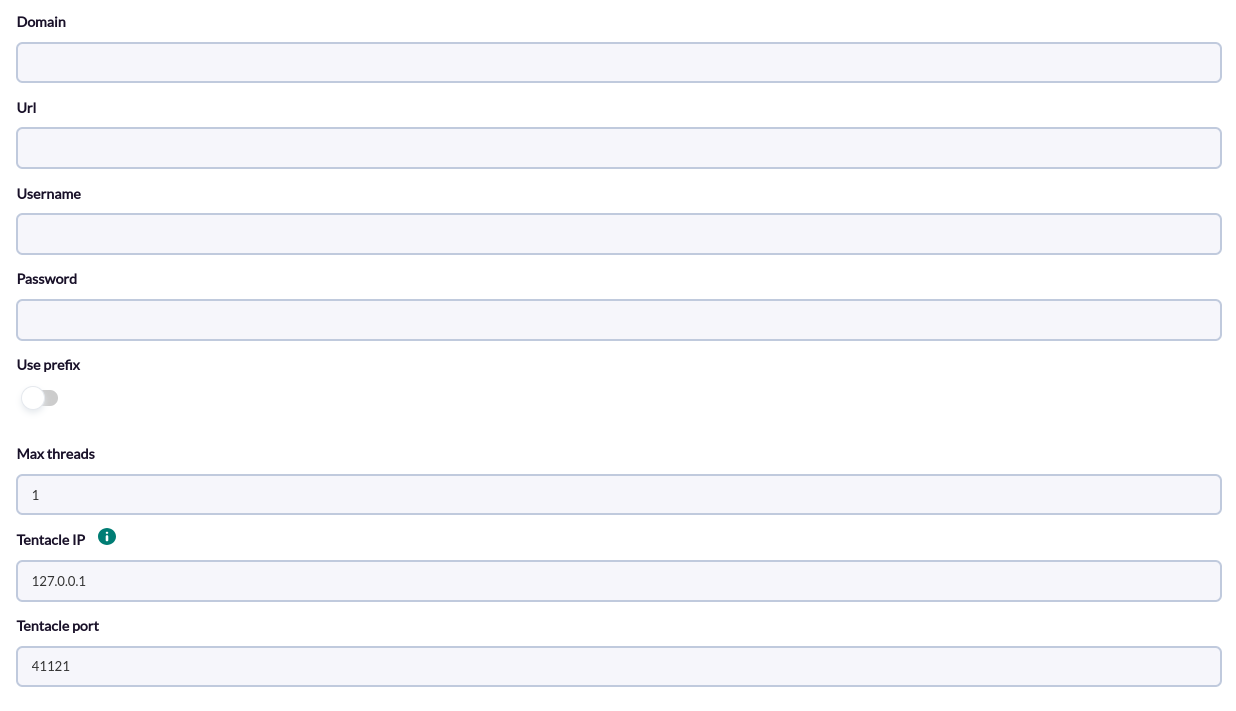
The following minimum data will be requested for each task:
- **Domain**: Domain name
- **Url**: Url of the environment
- **Username:** User name
- **Password:** User password
- **Use prefix:** To use prefix for the agents
- **Max threads:** Number of threads
- **Tentacle IP:** Tentacle address
- **Tentacle port:** Tentacle port
[](https://pandorafms.com/guides/public/uploads/images/gallery/2025-05/aQtimage.png)
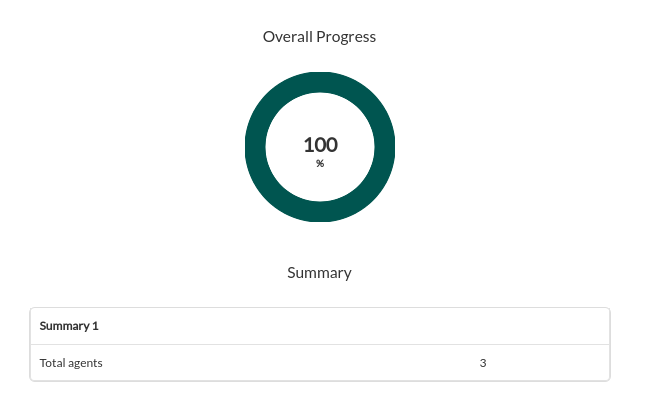
Successfully completed tasks will have an execution summary with the following information:
- **Total agents** : Total number of agents generated by the task.
[](https://pandorafms.com/guides/public/uploads/images/gallery/2024-03/i97image.png)
# Agent and modules generated by the plugin
The execution will create the following agents, with the following modules :
**Agent:**
VMware Horizon Desktop Pools
**Modules (for each Desktop Pool):**
<display\_name> num\_machines
<display\_name> num\_connected\_sessions
<display\_name> occupancy\_count
**Agent**:
VMware Horizon Rds-servers
**Modules (for each RDS Server - Inventory):**
<name><key>
**Modules (for each RDS Server - Monitor):**
<name> Agent Build
<name> Agent Version
<name> Max Sessions Count Configured
<name> Operating System
<name> State
<name> Enabled
<name> Farm ID
<name> Server ID
<name> Load Index
<name> Load Preference
<name> Name
<name> Session Count
<name> Status
**Agent:**
VMware Horizon Sessions
**Modules:**
Sessions
Active App Sessions
Disconnected App Sessions
Idle App Sessions
Pending App Sessions
Android Clients
Browser Clients
iOS Clients
Linux Clients
Mac Clients
Other Clients
Windows Clients
Active Desktop Sessions
Disconnected Desktop Sessions
Idle Desktop Sessions
Pending Desktop Sessions
External Gateways
Internal Gateways
Unknown Gateways
BLAST Sessions
Other Protocols
PCOIP Sessions
RDP Sessions
**Agent**:
VMware Horizon Machines
**Modules:**
<MACHINE\_NAME> Pairing State
<MACHINE\_NAME> State
<MACHINE\_NAME> Last Maintenance Time
<MACHINE\_NAME> Memory MB
<MACHINE\_NAME> Operation State
<MACHINE\_NAME> Disk Capacity MB
**Agent:**
Physical machines
**Modules**:
<MACHINE\_NAME>
**Agent:**
VMware Horizon Persistent Disks
**Modules:**
<DISK\_NAME> Access Group ID
<DISK\_NAME> Capacity MB
<DISK\_NAME> Datastore ID
<DISK\_NAME> Datastore Name
<DISK\_NAME> Desktop Pool ID
<DISK\_NAME> Desktop Pool Name
<DISK\_NAME> Disk ID
<DISK\_NAME> Last Attached Time
<DISK\_NAME> Machine ID
<DISK\_NAME> Machine Name
<DISK\_NAME> Status
<DISK\_NAME> Usage
<DISK\_NAME> User ID
<DISK\_NAME> User Name
<DISK\_NAME> vCenter ID
**Agent:**
VMware Horizon Health Metrics
**Modules**:
<COMPONENT> Error Count
<COMPONENT> Healthy Count
<COMPONENT> Total Count
<COMPONENT> Unknown Count
<COMPONENT> Warning Count
**Agent:**
VMware Horizon Connection Servers
**Modules (for each server):**
<SERVER\_NAME> Connection Count
<SERVER\_NAME> CS Replications
<SERVER\_NAME> Last Updated Timestamp
<SERVER\_NAME> Name
<SERVER\_NAME> Services
<SERVER\_NAME> Session Protocol Data
<SERVER\_NAME> Session Threshold
<SERVER\_NAME> Status
<SERVER\_NAME> Tunnel Connection Count
<SERVER\_NAME> Unrecognized PCOIP Requests Count
<SERVER\_NAME> Unrecognized Tunnel Requests Count
<SERVER\_NAME> Unrecognized XMLAPI Requests Count
**Agente:**
VMware Horizon App Volumes
**Módulos (por cada servidor de conexión dentro de cada app volumes manager):**
<SERVER\_NAME> Certificate Valid
<SERVER\_NAME> Certificate Valid From
<SERVER\_NAME> Certificate Valid To
<SERVER\_NAME> Status
<SERVER\_NAME> Thumbprint Accepted
**Agente**:
VMware Horizon Gateways
**Modules for each gateway (<name>):**
<name> Active Connection Count
<name> Blast Connection Count
<name> Last Updated Timestamp
<name> PCOIP Connection Count
<name> Status
**Agent:**
VMware Horizon Usage Metrics
**Modules:**
Usage Metrics Current Concurrent Application Sessions
Usage Metrics Current Collaborative Sessions
Usage Metrics Current Full VM Sessions
Usage Metrics Current Unmanaged VM Sessions
Usage Metrics Total Collaborators
Usage Metrics Total Concurrent Connections
Usage Metrics Total Concurrent Sessions
Usage Metrics Total Named Users
Usage Metrics Highest Concurrent Application Sessions
Usage Metrics Highest Collaborative Sessions
Usage Metrics Highest Full VM Sessions
Usage Metrics Highest Unmanaged VM Sessions
Usage Metrics Highest Total Collaborators
Usage Metrics Highest Total Concurrent Connections
Usage Metrics Highest Total Concurrent Sessions
Usage Metrics Highest Total Named Users
**Agent:**
VMware Horizon System Metrics
**Modules**
System Metrics Event Error Count
System Metrics Event Warning Count
System Metrics Health Metrics Component
System Metrics Health Metrics Error Count
System Metrics Health Metrics Healthy Count
System Metrics Health Metrics Total Count
System Metrics Health Metrics Unknown Count
System Metrics Health Metrics Warning Count
System Metrics Problem RDS Hosts Count
System Metrics Problem vCenter VMs Count
System Metrics Sessions Count
**Agent:**
VMware Horizon Virtual Datacenters
**Modules generated by each virtual datacenter (<vc\_name>):**
<vc\_name> Connection Server <server\_name> Server Status
<vc\_name> Datastore <datastore\_name> Path
<vc\_name> Datastore <datastore\_name> URL
<vc\_name> Datastore <datastore\_name> Capacity MB
<vc\_name> Datastore <datastore\_name> Free Space MB
<vc\_name> Datastore <datastore\_name> Status
<vc\_name> Host <host\_name> Cluster Name
<vc\_name> Host <host\_name> CPU Core Count
<vc\_name> Host <host\_name> CPU MHz
<vc\_name> Host <host\_name> Memory Size MB
<vc\_name> Host <host\_name> Overall CPU Usage MHz
<vc\_name> Host <host\_name> Overall Memory Usage MB
<vc\_name> Host <host\_name> Status
<vc\_name> Desktop Pools and Farms