Create your first Dashboard
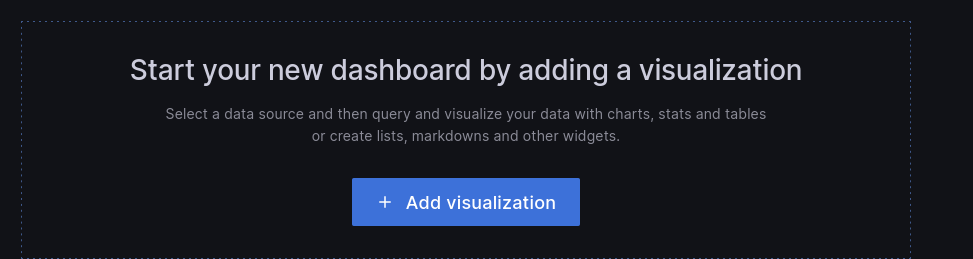
First we have to go to the "Create > Dashboard" menu, and in the panel that will appear click on the "Add visualization" button:
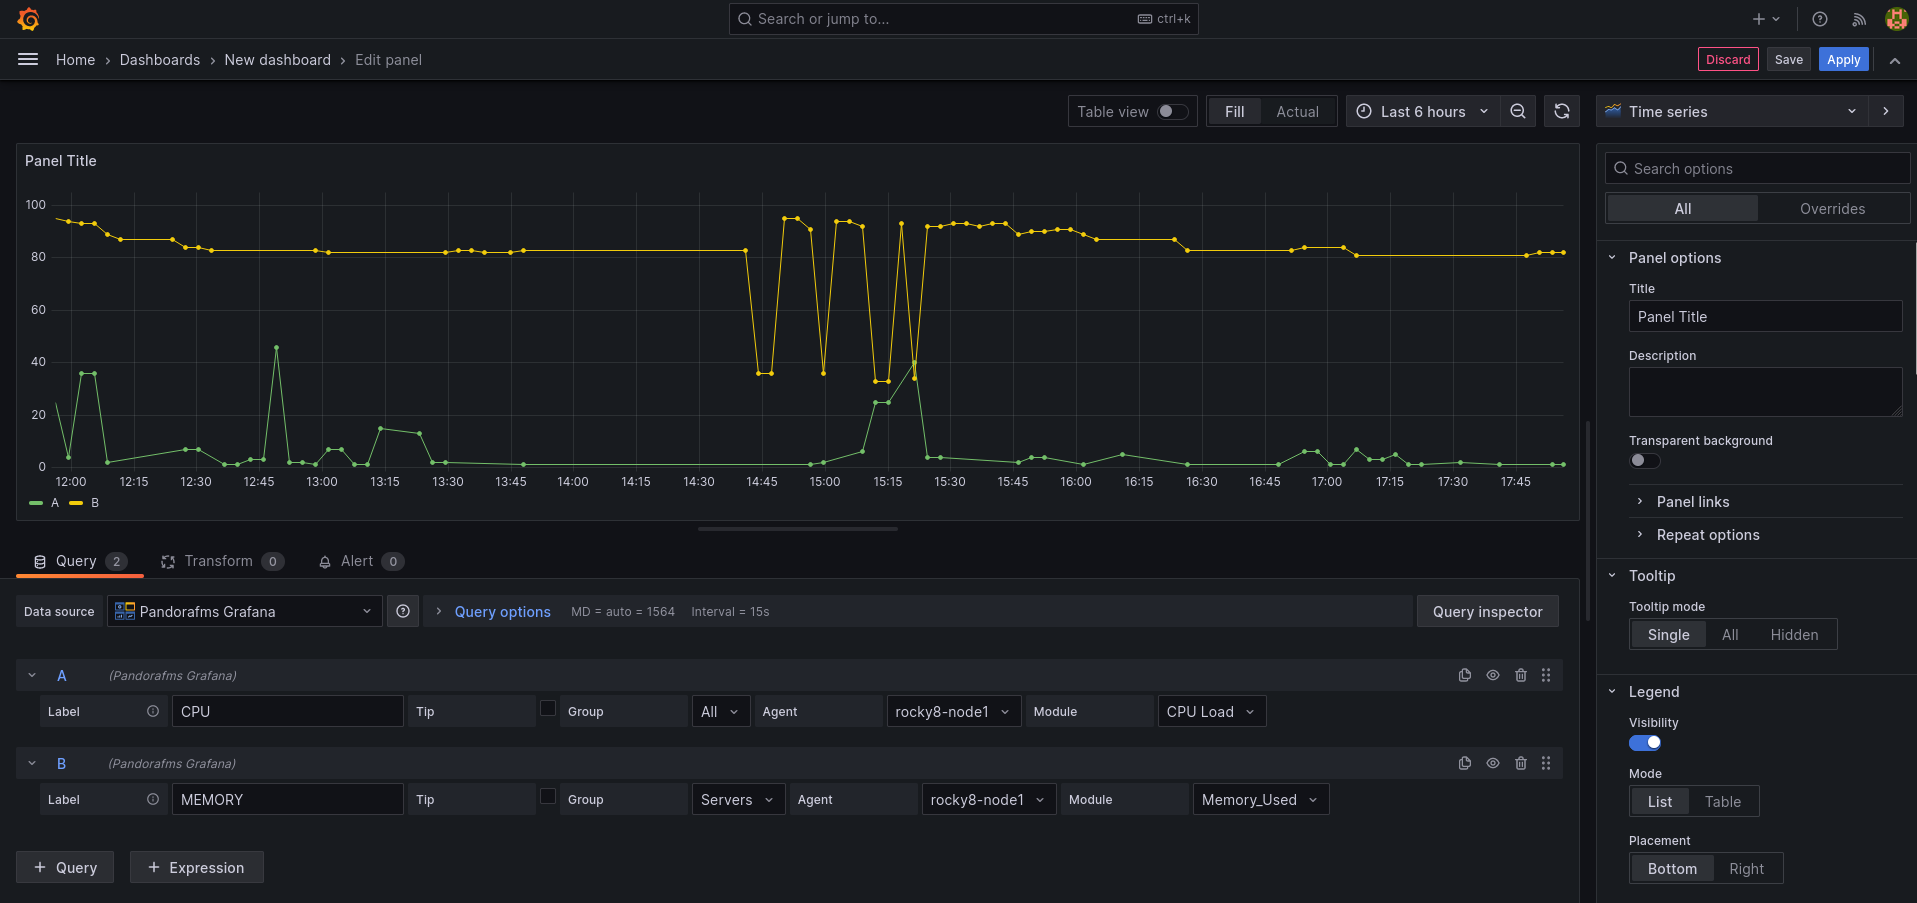
This will take us to a form where, in the "Query" dropdown, we will choose our "Pandora FMS" data source. This will make the lower part of the form change and we will see a query to choose a module to show the data in the panel:
- Label: It will allow us to indicate the label we want the data represented for this query to have.
- Group: We will use it to filter the agent to represent the data. It is necessary to indicate a group.
- Agent: We will use it to filter the module from which to represent the data. It is necessary to indicate some agent.
- Module: We will use it to indicate exactly the module from which to represent the data.
- TIP: It is a field that will allow us to indicate if the data to represent will be compacted or not. If it is not checked, the data will be compacted, which will result in graphs that are easier to interpret and faster to load, although the data sample will not be the real one but rather an average of them.
And with this we would have our first Pandora FMS data in Grafana.
We can include more than one query in the same panel, which allows us to compare data from different modules:
And we can also add more panels within the same Grafana dashboard, so that we have all the necessary information on the same screen.