Grafana
Datasource that enables the possibility of obtaining your PandoraFMS metrics in Grafana.
- Introduction
- Prerrequisites
- Configure the integration
- Create your first Dashboard
- Create your first alert
Introduction
The purpose of this plugin is to integrate your PandoraFMS data in Grafana, being able to visualize this data or create alerts with them.
The plugin is a React component that makes use of the Grafana Dashboard to visualize the data, and requires the use of an API extension in Pandora to be able to make use of them.
Prerrequisites
- Access from Grafana to the Pandora machine that is going to receive the data and that has the API Extension loaded.
- Enable the plugin id in the grafana configuration file.
To see more details about the requirements and to be able to configure the integration see the section "Configure the integration".
Configure the integration
1) Loading the Pandora FMS plugin for Grafana
We will have to upload to the Grafana server the ZIP file with all the plugin files and place it in the path "/var/lib/grafana/plugins". Unzip the file in this path with the "unzip" command and restart the Grafana service to load it:
cd /var/lib/grafana/plugins
unzip pandorafms_grafana_datasource.zip
service grafana-server restart
2) Configuring Pandora FMS as data source for Grafana dashboards
Add the following lines to the end of the Grafana configuration file (/etc/grafana/grafana.ini):
[plugins]
allow_loading_unsigned_plugins = "pandorafms-pandorafmsgrafana-datasource"
After this change the Grafana service must be restarted using the following command:
At this point what we have to do is to configure the plugin uploaded in Grafana so that it connects with the extension loaded in Pandora FMS and allows us to use its data in the Grafana dashboard.
We have to access in Grafana to the "Configuration > Datasources" menu and click on the "Add datasource" button
service grafana-server restart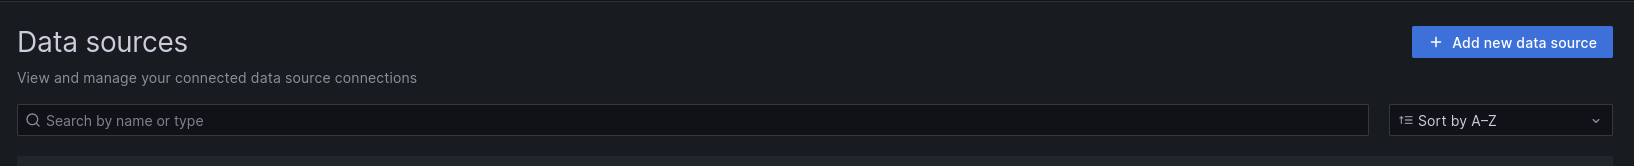
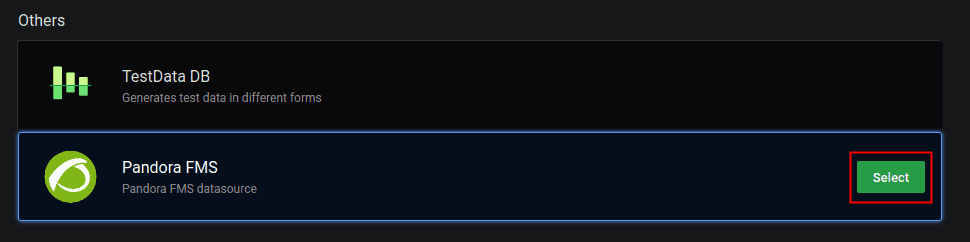
We will see different plugins that we can configure, and at the bottom of the list we will see the plugin that we have just loaded for Pandora FMS. Click on it:
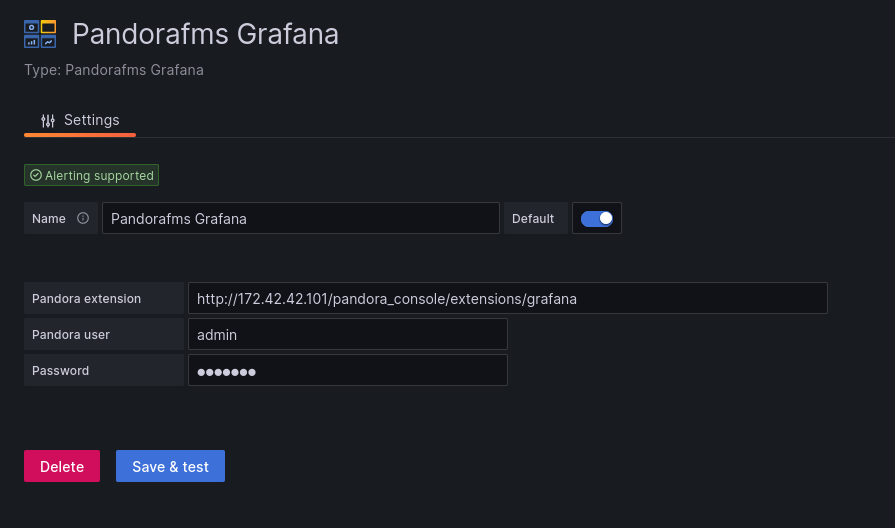
This will take us to a form where we only need to fill in 3 fields for the connection with the Pandora FMS extension:
URL to the extension, which according to the suggestion we will see will be (by default) "http://x.x.x.x/pandora_console/extensions/grafana", being "x.x.x.x.x" the IP address or DNS name to our Pandora FMS console.
Pandora FMS user, which will allow us to obtain the data for the Grafana dashboards. This user must have at least agent reading permissions (AR) and will only be able to obtain data from those agents over which he/she has permissions.
Pandora FMS user password.
With these fields completed, we can click on the "Save & Test" button to verify the operation of our new data source:
What happens if it does not work correctly? In configuration we could see different errors, such as:
HTTP Error Bad Gateway → If Grafana could not connect to Pandora FMS or if the indicated IP address was incorrect.
HTTP Error Not Found → If the indicated URL was not correct, for example because the Pandora FMS extension was not loaded correctly or simply because of an error when writing the URL in the form.
Datasource connection error: Unauthorized → If the indicated user and/or password were not correct or if the user did not have the minimum permissions to read agents (AR).
Create your first Dashboard
First we have to go to the "Create > Dashboard" menu, and in the panel that will appear click on the "Add visualization" button:

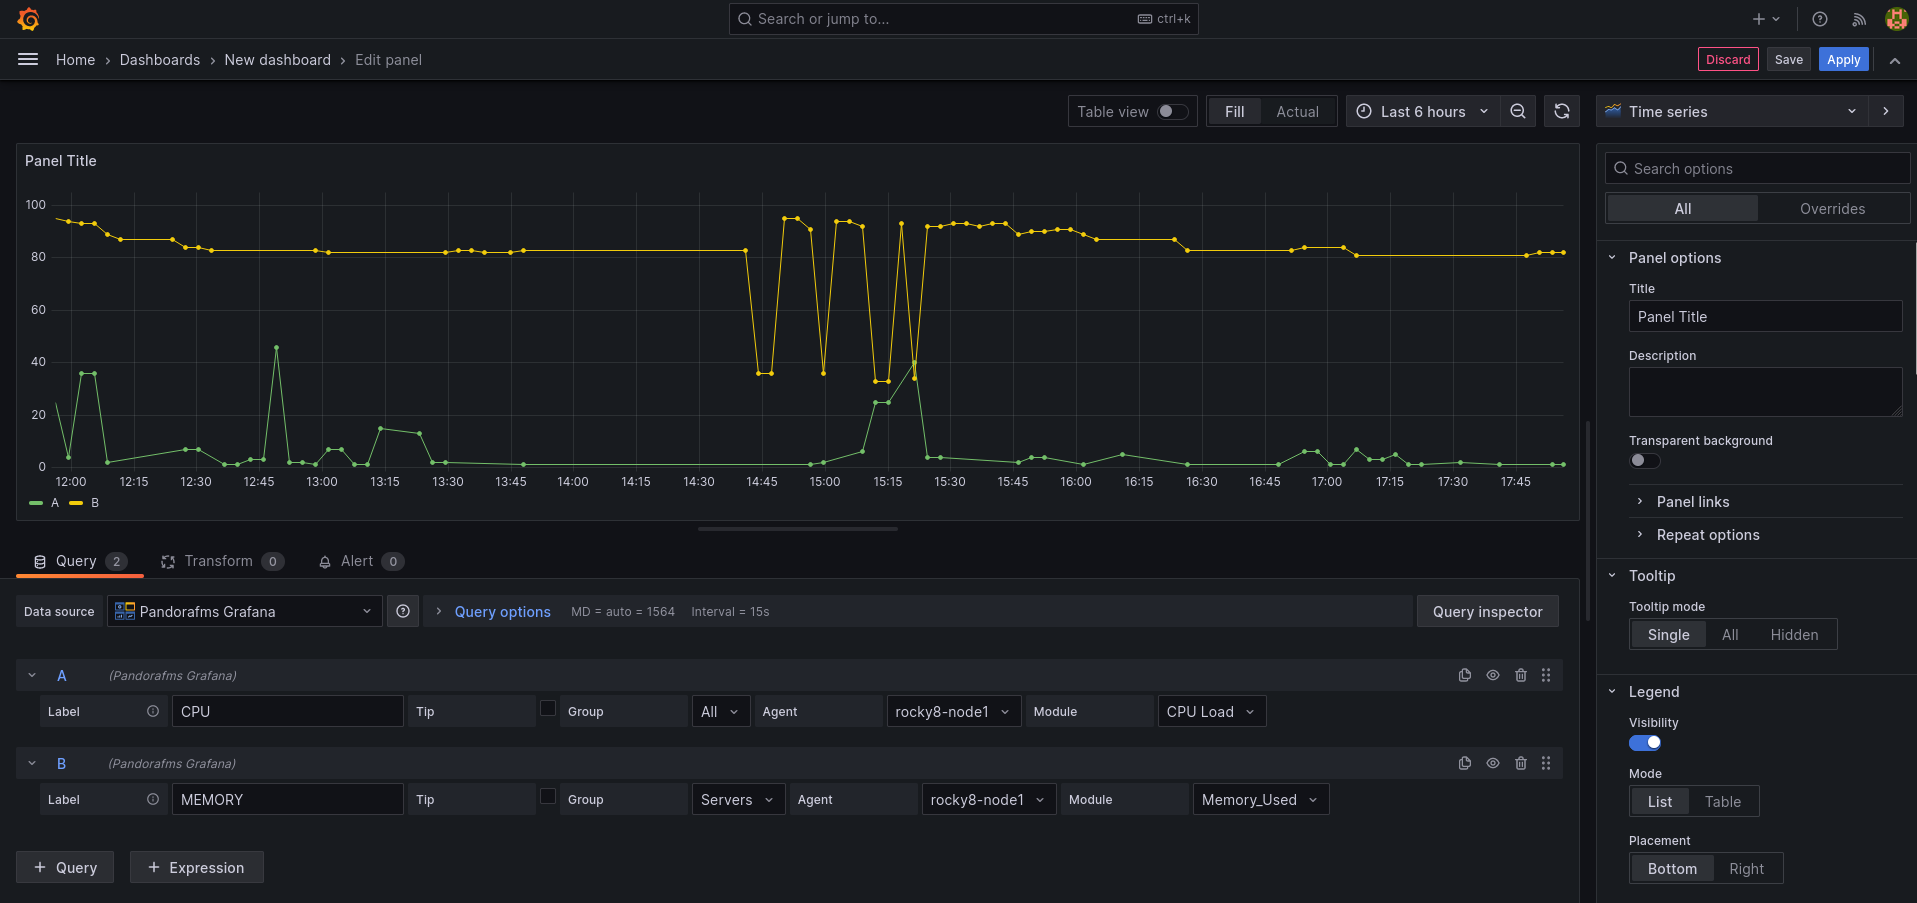
This will take us to a form where, in the "Query" dropdown, we will choose our "Pandora FMS" data source. This will make the lower part of the form change and we will see a query to choose a module to show the data in the panel:
- Label: It will allow us to indicate the label we want the data represented for this query to have.
- Group: We will use it to filter the agent to represent the data. It is necessary to indicate a group.
- Agent: We will use it to filter the module from which to represent the data. It is necessary to indicate some agent.
- Module: We will use it to indicate exactly the module from which to represent the data.
- TIP: It is a field that will allow us to indicate if the data to represent will be compacted or not. If it is not checked, the data will be compacted, which will result in graphs that are easier to interpret and faster to load, although the data sample will not be the real one but rather an average of them.
And with this we would have our first Pandora FMS data in Grafana.
We can include more than one query in the same panel, which allows us to compare data from different modules:
And we can also add more panels within the same Grafana dashboard, so that we have all the necessary information on the same screen.
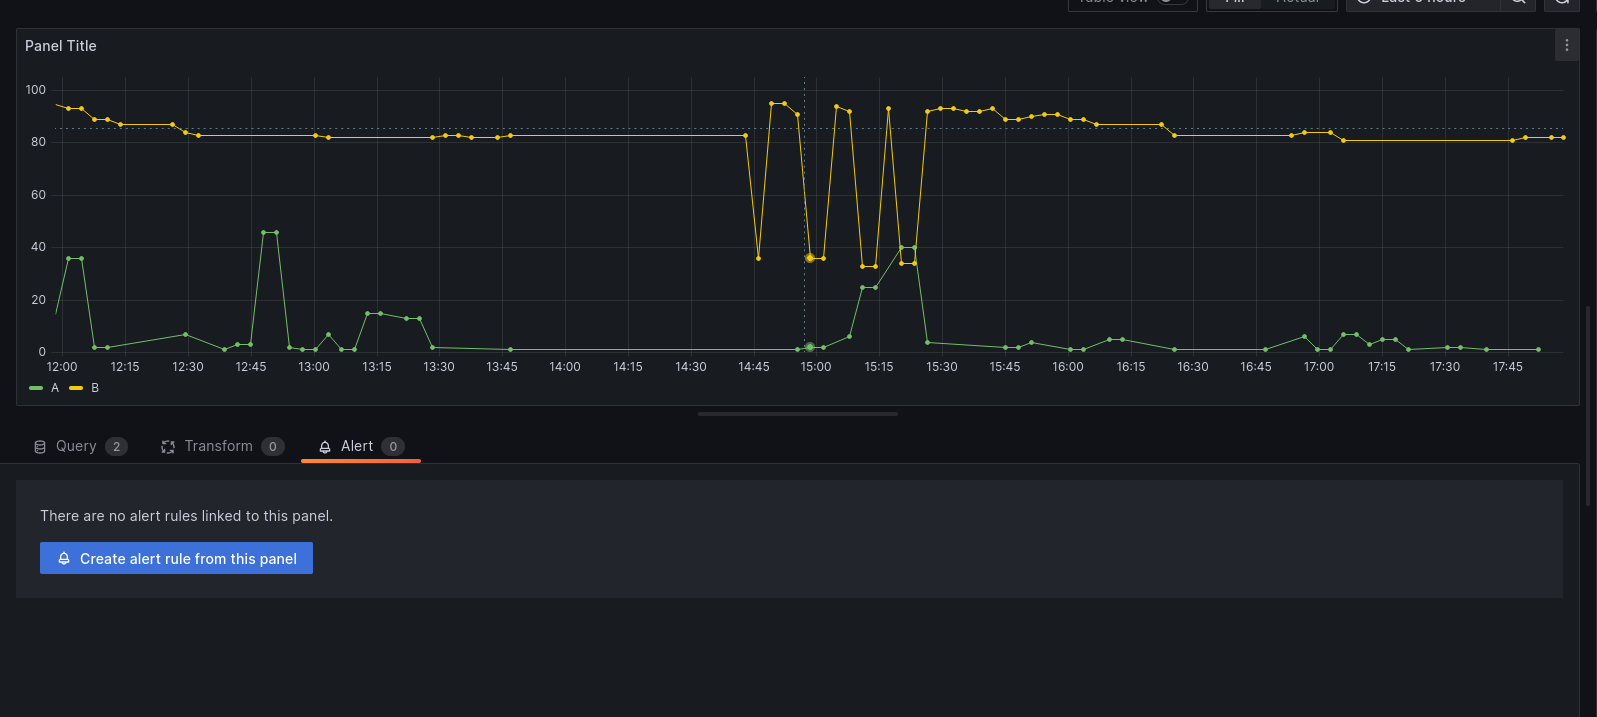
Create your first alert
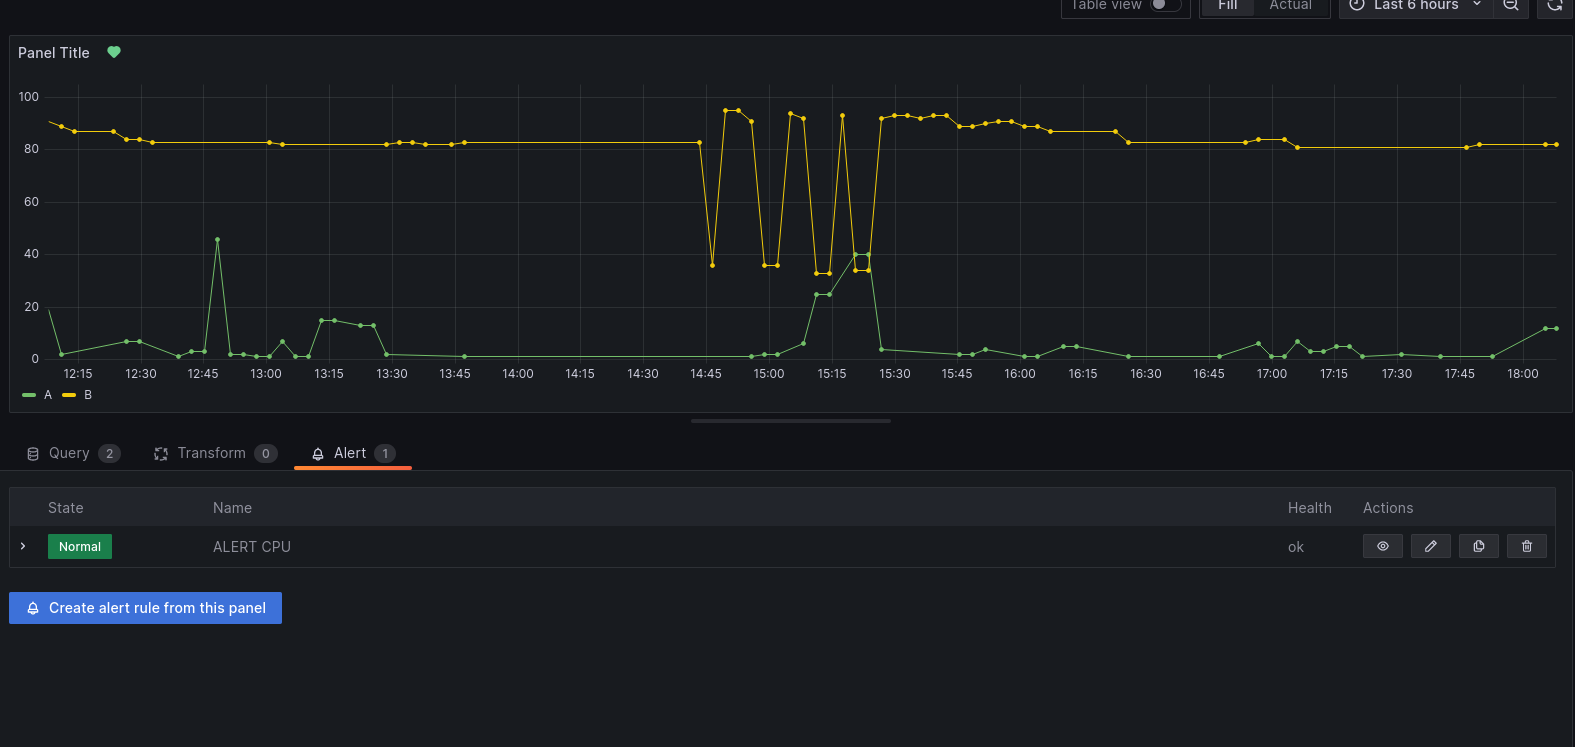
You can create an alert from the "Alert" menu in the dashboard display (once the Dashboard is saved). menu, in the dashboard display (once the Dashboard is saved).
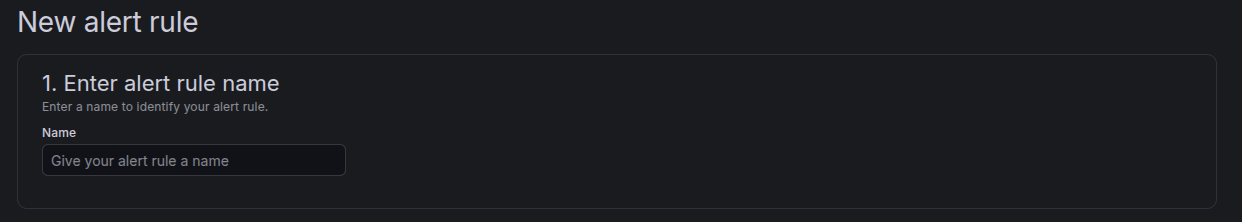
1 . Set the name of the alert rule.
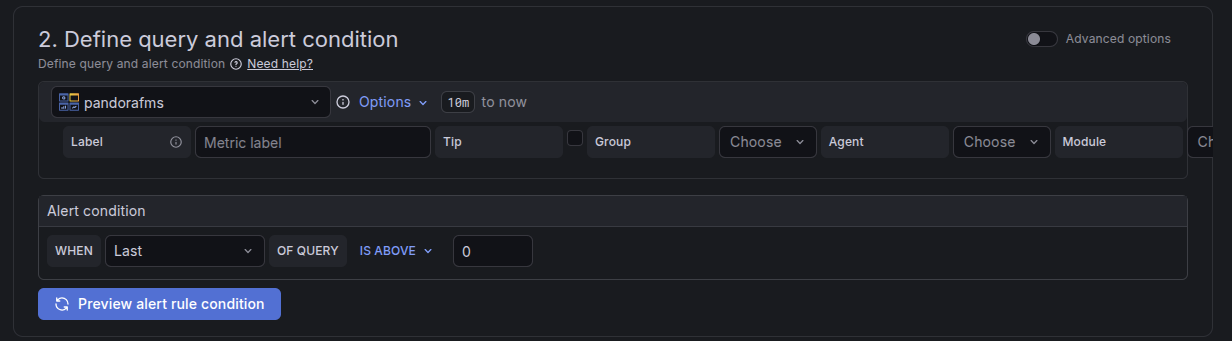
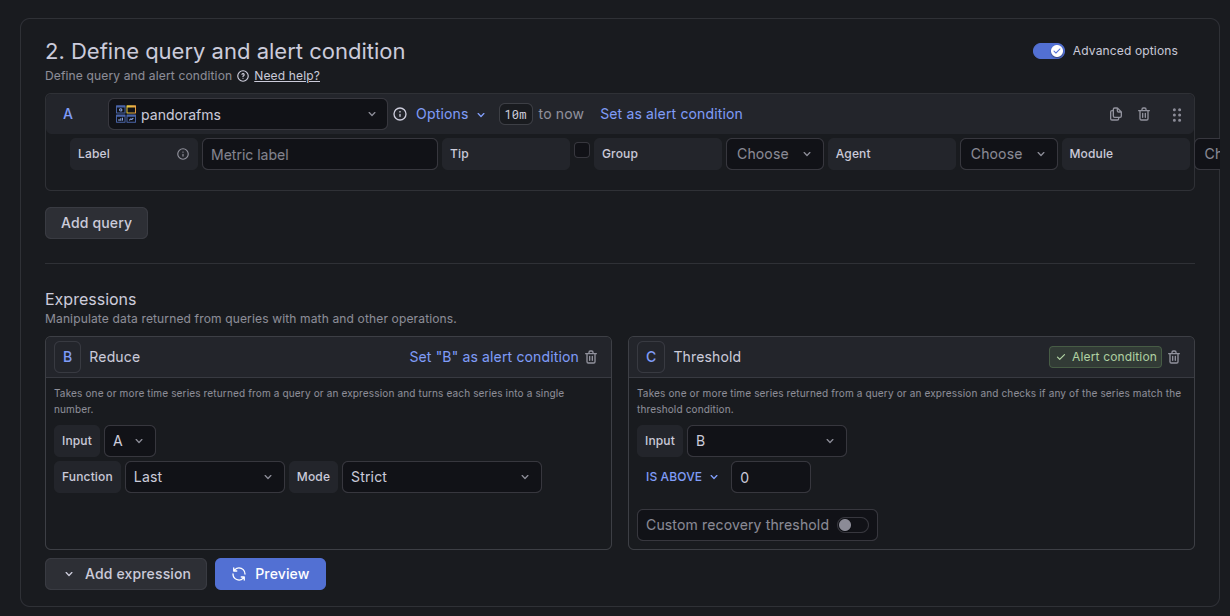
2. Define the query and alert condition
Advanced mode:
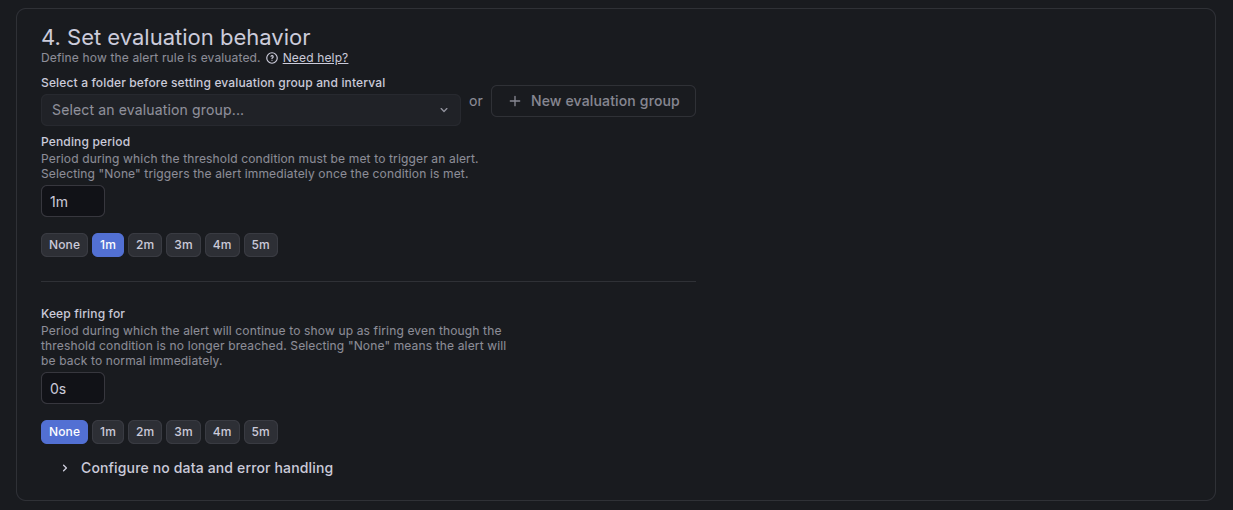
3. Establish alert evaluation behavior
4. Adding annotations
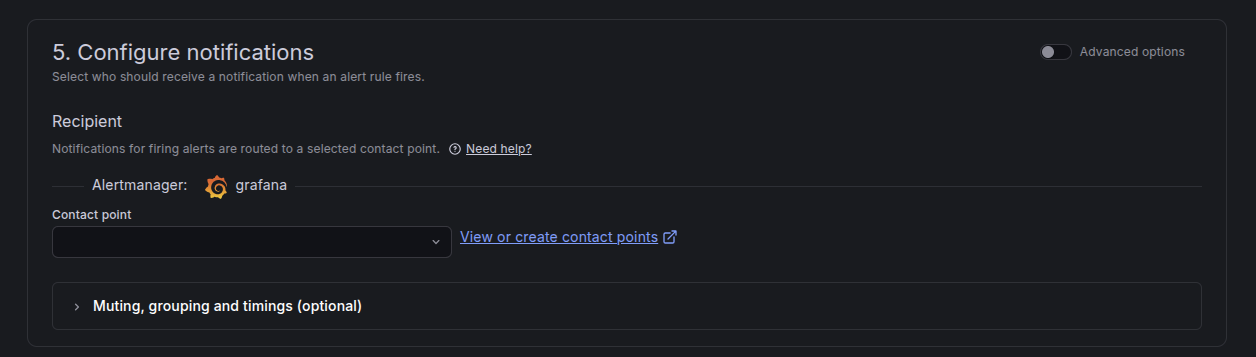
5. Configure notifications
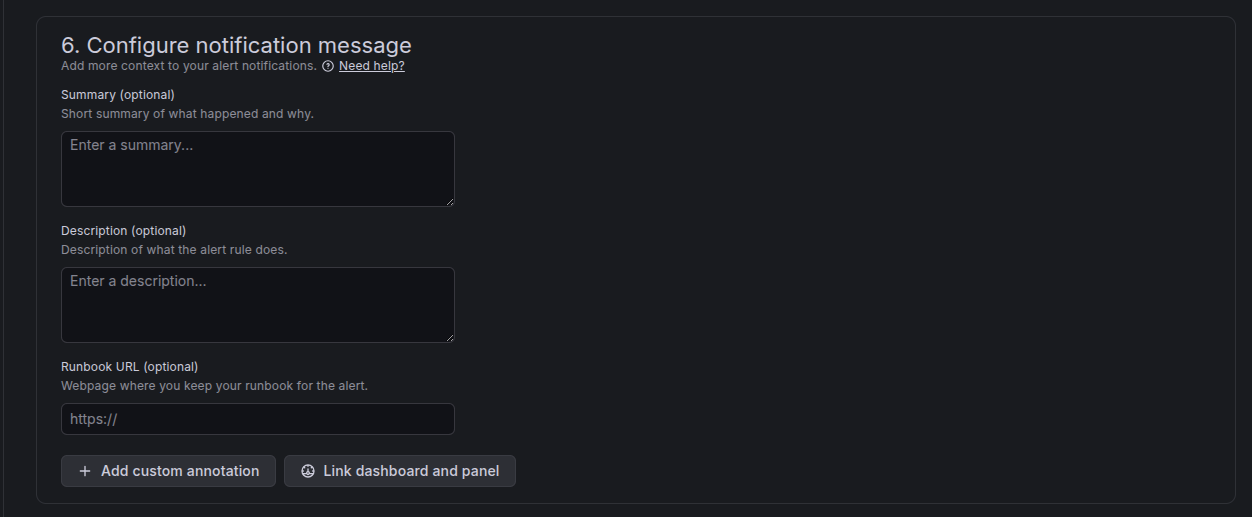
6. Configure message notifications
Once the alert has been configured and saved, it can be viewed on the dashboard: