14. Create a Custom Report
Pandora FMS offers us the possibility of visualizing monitored data in a personalized way through reports that can be scheduled for email delivery in various formats, exported to PDF, or viewed in real time.
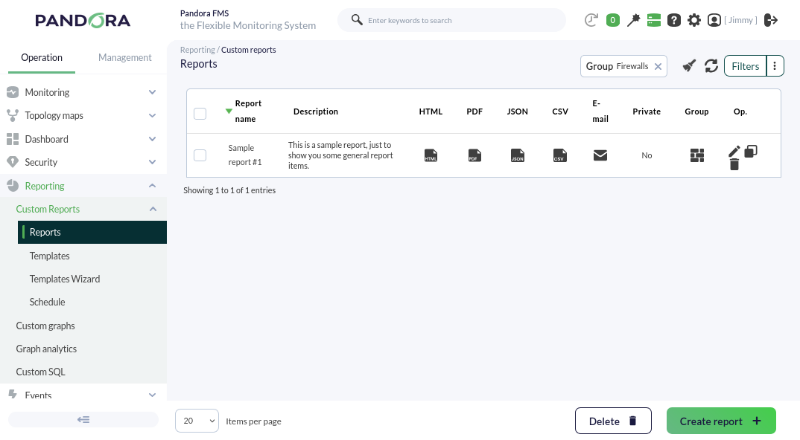
To create a custom report, we will access the menu Operation → Reporting → Custom reports → Reports, where the Create report + button will be available to allow us to create our first report.
The first step will be to define a name, group, write access, and the option to make it an interactive report or not.
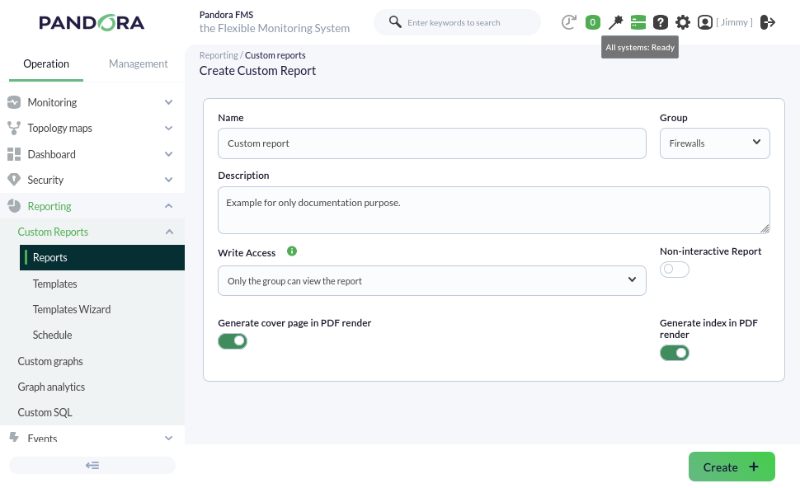
Non-interactive reports are reports that, due to their large size, are better off being scheduled only, as they take time to generate and will therefore have limited visualization via the Web Console.
Once we have filled in this data according to the desired requirements, we see that the top right menu offers new possibilities, allowing us to start adding different items from the monitoring we are conducting.
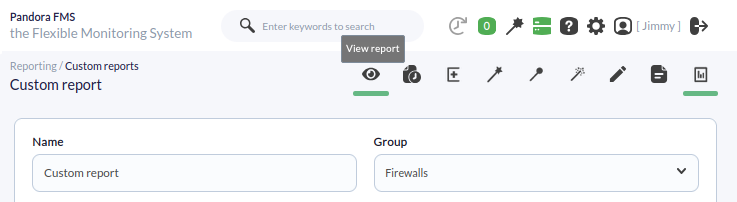
The first option is View report to visualize the report, followed by:
- Report task: Even if the report is interactive, it can always be scheduled, periodically or not, for email delivery or local storage (or on a shared network drive). Schedules created with this option can be modified (or deleted) in the menu Operation → Reporting → Custom reports → Scheduled.
- Advanced options: Where you can modify the cover page, page orientation, etc. (PDF format).
- Global: A wizard with two powerful and fast options to create Top N reports (General or Exceptions); the search for agents and modules offers filtering by regex and other useful options.
- SLA-Wizard: A dedicated wizard for Service Level Agreement (SLA) compliance reports.
- Wizard: To quickly generate the most commonly used report types (alerts, events, grouped, etc.).
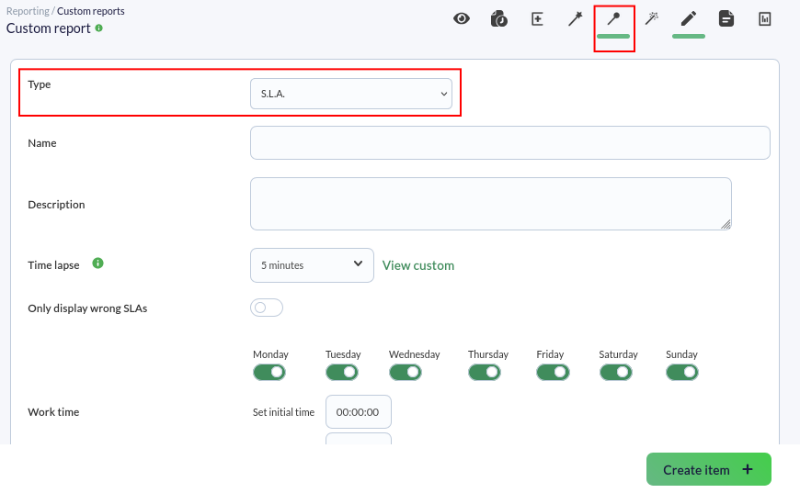
- Item editor: Where you can add more and more report types (remember, you can always mark as Non-interactive if the report becomes too large).
- List items: To edit or delete elements added in the previous option.
- Main data: To edit the same fields specified during the report creation.
Below is a brief description of some of the options mentioned above.
Wizard
General wizard that allows us, for example, to add graphs from different agents/modules to the report:

This wizard allows you to easily create other types of elements within the report, such as displaying maximum, minimum, or average values of modules over a time interval, a list of triggered alerts, or generated events.
SLA Wizard
This wizard allows us to create SLA report items automatically. You can choose the validity ranges for the values of the modules to be selected. This feature allows you to check the % of time a module has maintained values within specific ranges. If thresholds are not defined, they will dynamically adjust to the criticality thresholds of each module. In short, you will be able to know what % of the time they behaved as expected.
Global
Grouped reports are also available:
- Global: In this section of the report, we can create Exception, General, or Top N elements simply by using a wizard.
- Exception: This shows values from several modules that satisfy a logical operation (e.g., show the % occupancy of those links that have an activity higher than 100 KB/Sec).
- General: Shows values from several modules sorted (ascending, descending, by agent name) and/or grouped by name.
- Top N: Shows N values discriminated by maximum, minimum, or average over the total modules added, sorted ascending, descending, or by agent name.
In this way, we can add different modules from different agents, while also choosing the operation to be performed for each module: sum, average, minimum, maximum.
Item editor
In this tab, we can find more specific elements, such as the possibility of creating inventory elements for our reports.
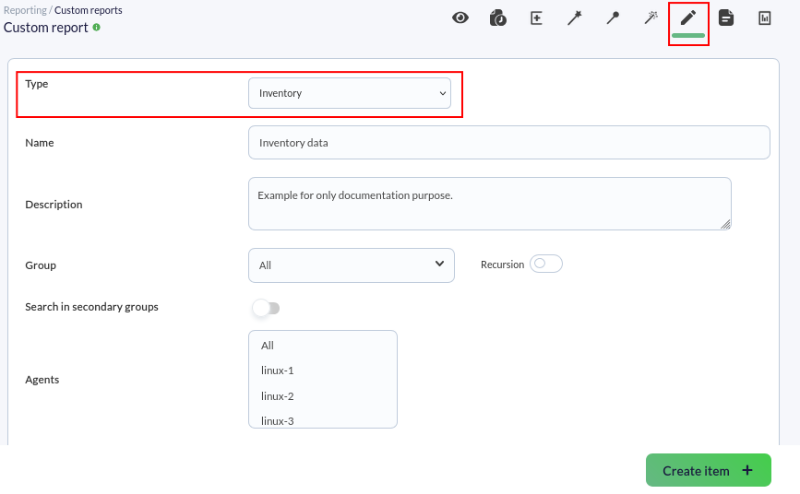
This will allow us to display hardware and software data for the agents we select, provided they have inventory value collection enabled.
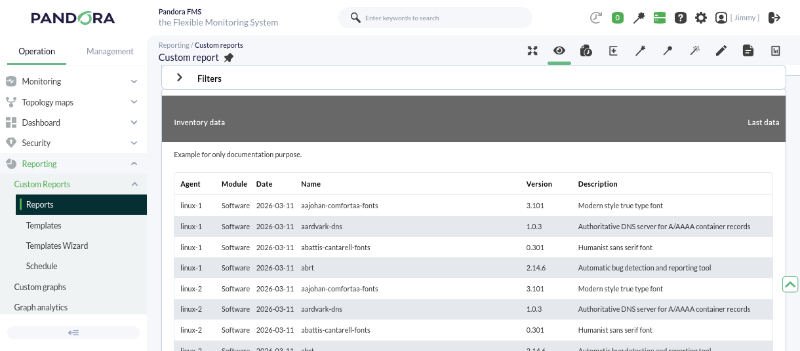
Once the reports are configured, we can view them using the View report icon. In the case of our report, these are the results:
Are you not achieving the results explained in this chapter? Access the help or support section.