First steps with Pandora FMS
Official start-up guide to get the most out of Pandora FMS, from installation to report generation. If you do not wish to delve into the manual, this is your guide.
- 1. Introduction
- 2. Basic Architecture
- 3. Installation
- 4. Detecting and monitoring new systems with Discovery
- 5. Detecting and monitoring network and Windows devices with Discovery
- 6. Network device monitoring through SNMP Interface Wizard
- 7. Network device remote monitoring
- 8. Web Monitoring
- 9. Remote Server Monitoring
- 10. Server Monitoring through EndPoints
- 11. Module Advanced Settings
- 12. How to use Pandora FMS plugins
- 13. Email Alert
- 14. Create a Custom Report
- 15. Visual Console Creation
- 16. Dashboard creation
- 17. Inventory
- 18. Events
- 19. Working with Policies in Pandora FMS
- 20. Next Steps
- 21. Where to Look if Problems Arise?
- 22. Support
1. Introduction
The purpose of this guide is to introduce Pandora FMS in a quick and concise way to someone who is not familiar with the tool.
The aim is not to take a tour through all the features of Pandora FMS, but rather to talk about those most relevant to being able to manage and operate in record time.
The architecture of Pandora FMS is composed of different services:
- A DB server (Percona/MySQL).
- A Web Console.
- A Pandora FMS Server (which in turn runs different types of services).
- A small optional application (EndPoint) that runs on the servers where you want to collect information (both MS Windows® and Linux®) and sends it to the central server. An EndPoint is the piece of software that collects information and an Agent is how that information is visualized and managed.
We call an agent any computer or device on the network that is ready to be monitored. That is, everything from which we can obtain data and has an associated IP address, such as servers, routers, or switches.
The number of these agents is what is used to license a Pandora FMS installation.
The information collected in each of these agents is irrelevant; it does not matter if it is a router with just a few simple metrics or a 48-port switch full of information. These metrics in Pandora FMS are known as modules.
Minimum hardware requirements
The requirements shown in this table are the minimum recommendations for the various installations. These recommendations are calculated assuming that 80% of the modules have data history, each agent has an average of 10 modules, and the average sampling is five minutes. These recommendations are specified for an environment where the database, PFMS Server, and Web Console are installed on the same server:
| Hardware | SMALL | MEDIUM | LARGE |
|---|---|---|---|
| CPU | 2 cores at 2 GHz | 4 cores at 2.5 GHz | 6 cores at 3 GHz |
| RAM | 4 GB | 8 GB | 16 GB |
| Storage device | 15 K RPM or SSD | 15 K RPM or SSD | SSD |
| Storage space | ~20 GB | ~60 GB | ~120 GB |
| Capacity | Up to 1,000 modules | Up to 10,000 modules |
Up to 30,000 modules |
In addition to the above recommendations, it is recommended to install MySQL on a separate server and install Percona XTraDB instead of standard MySQL.
- If you already have a Pandora FMS installation, let's go directly to device discovery here
- Everything discovered and configured? Let's move on to metric alerting here
- I need to start visualizing my data; let's start with reports here
2. Basic Architecture
Pandora FMS Servers
The Servers are integrated into a single application, generically called PFMS Server, which is a multi-threaded application that concurrently executes different instances or specialized Pandora FMS servers. These are the elements in charge of performing the existing checks as they verify and change their status based on the results obtained. They are also responsible for triggering the alerts established to control data status.
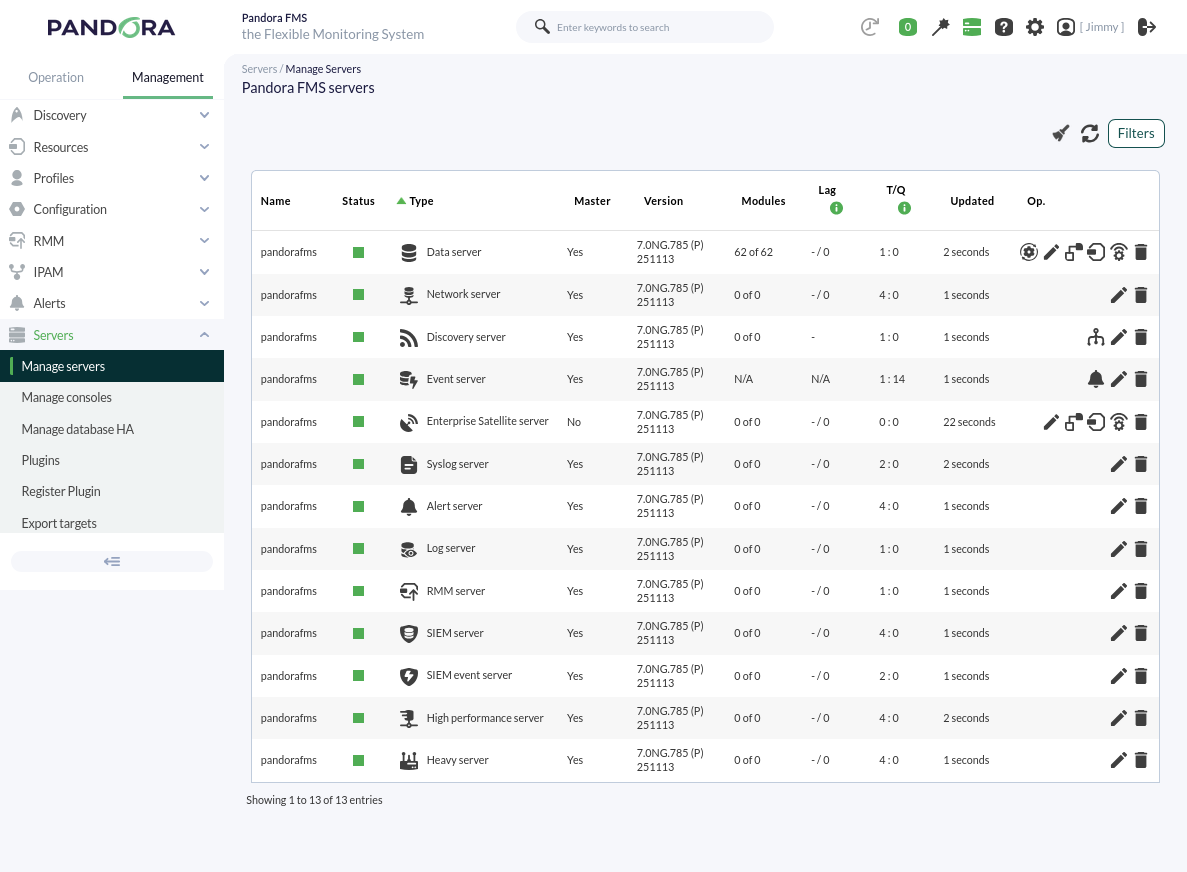
Pandora FMS automatically manages the status of each server, its load level, and other parameters. The user can monitor the status of each server through the server status section of the Web Console:
Basic Servers
Data Server (enabled by default): It is responsible for processing the information sent by the EndPoints (in XML format); the server processes it and stores the result in the database. It is also responsible for generating alerts and events based on that data, the latter being of critical importance. To enable the server, it is necessary to configure the line dataserver 1 in the file /etc/pandora/pandora_server.conf .
In the remote configuration (Web Console) of the Data Server, the rest of the servers can be visually activated. It also has the extra option of viewing and editing the file /etc/pandora/pandora_server.conf.
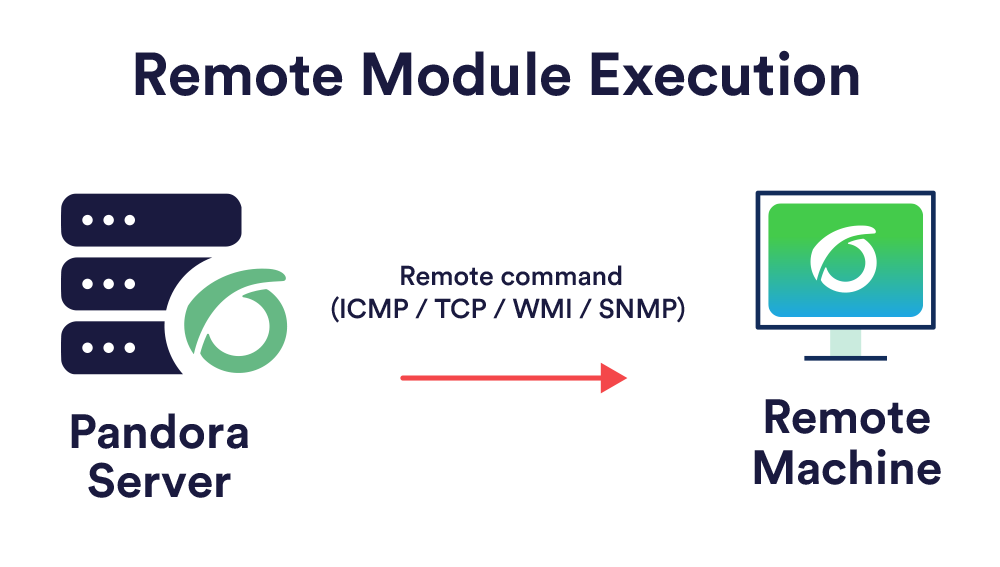
Network Server (enabled by default): This server performs remote monitoring tasks through the network, which can be ICMP checks, TCP requests, and SNMP requests. The server and remote machines must have communication to perform these checks. As of version 785, this server also includes the following tasks:
- Predicts numerical values using statistics and modules with real data as a source, allows detecting anomalies outside usual trends, and creates new values from prediction statistics, which can be used as baselines. It also allows creating new values through arithmetic operations with the values of existing modules (synthetic modules).
- Remotely monitors MS Windows® systems using the WMI® protocol. This is done by executing WMI statements, remote statements compatible with any Windows system with WMI enabled that allow obtaining Hardware and Software information.
- Perform complete web checks, from the user identification process to passing parameters via forms, content checking, menu navigation, etc. It allows for availability checks (works or does not work) and obtaining latency times (in seconds) of the complete browsing experience, including resources associated with the page (images, full texts, etc.).
Discovery Server (enabled by default): Allows exploring networks to detect equipment and apply monitoring templates quickly. It also allows the rapid deployment of specific monitoring for databases, cloud systems, and virtual environments through DISCO packages. It includes the necessary tools to discover or import devices and equipment on the network. To enable the server, it is necessary to configure the line discoveryserver 1 in the file /etc/pandora/pandora_server.conf .
Heavy server (enabled by default): performs complex checks remotely through customized scripts, managed centrally. This server allows an advanced user to define their own checks, developed by themselves, and integrate them into the application so they can be used conveniently from Pandora FMS. It also has several other important functions:
- It is responsible for managing monitored devices through NCM.
- If data export has been enabled and configured, basic information can be forwarded to another higher-level PFMS Server so that the latter has concentrated information to be analyzed and visualized (without altering the operation of the lower-level PFMS Server).
- Obtains and visualizes system inventory information: installed software, hardware element models, data storage devices, services running on the system, etc. This information can be obtained both remotely (from the PFMS Server) and locally (via the EndPoints). It does this with extensions developed by the user, for both MS Windows® and Linux®.
Network High Performance Server (enabled by default) handles the workloads of ICMP and SNMP checks:
- ICMP: Uses the nmap binary version 5.5 or later that is installed with Pandora FMS. They make up the basic monitoring checks such as connectivity and response time; by default, when creating an agent via the Web Console, it comes with two pre-configured modules for this.
- SNMP: Uses the braa binary which is also installed with Pandora FMS. This braa binary is located in
/usr/bin/braaby default. It is compatible with SNMP v1 and v2. It requires the Network Server to be operating simultaneously to be able to translate the received OIDs.
The number of threads that the processes will use in the instance where Pandora FMS is installed can be set for each server.
Pandora FMS Web Console
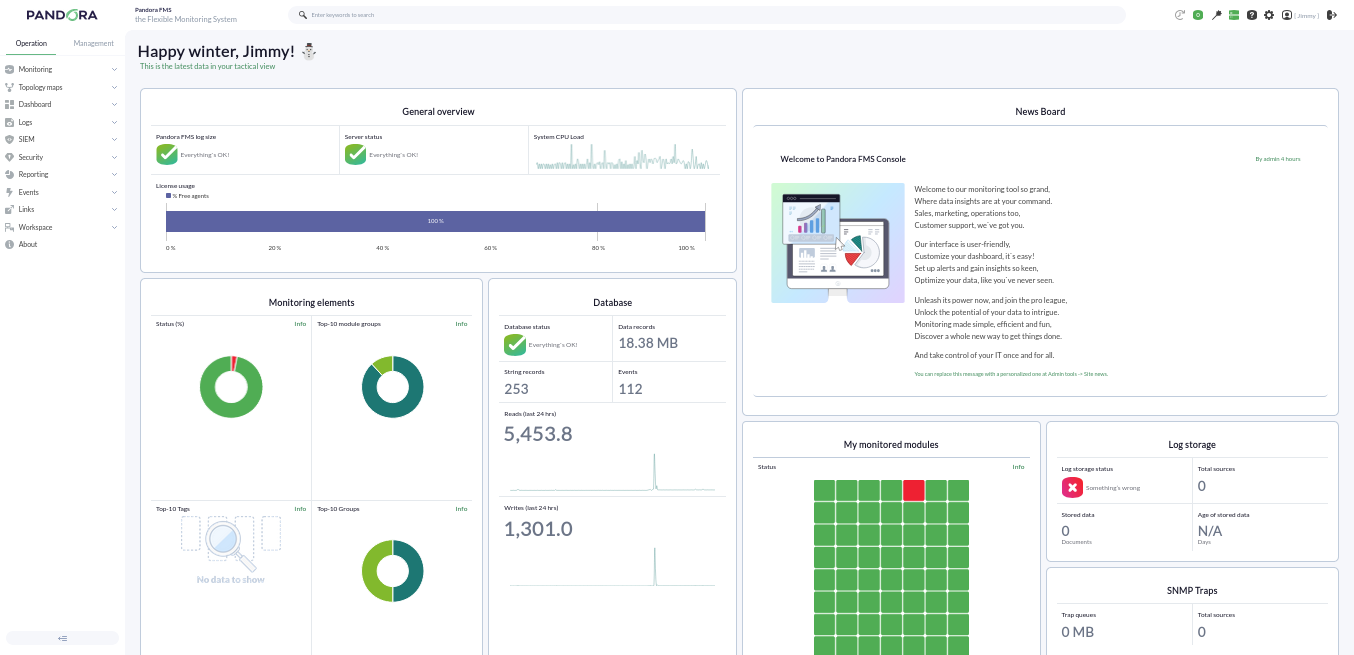
It is the Pandora FMS user interface, it allows monitoring the status of the Agents, viewing statistical information, and generating graphs and data tables. It is also capable of generating reports and centrally defining new agents, modules, alerts, and creating other users and profiles.
Pandora FMS Database
Pandora FMS uses a MySQL database where all the information received in real-time is stored, normalizing all data from the various source origins (server, agents, etc.).
Currently Pandora FMS only supports MySQL, MariaDB, and Percona.
Agents
In Pandora FMS there are two types of agents and they can execute remote and local type modules:
- Remote Agent: This type of agent is an organizational element created in the Pandora FMS Web Console; it usually contains remote-type modules that are executed by those servers that obtain information remotely, such as the Network Server.
- EndPoint: It is software installed on the equipment to be monitored locally, extracting information from the equipment itself; it allows monitoring machine resources (CPU, RAM, disks...) and installed applications (MySQL, Apache, JBoss). All information collected by the EndPoints is sent to the server in XML format via the Tentacle protocol (SSH or FTP can be used) at a default interval of 5 minutes (300 seconds) from their respective agent.
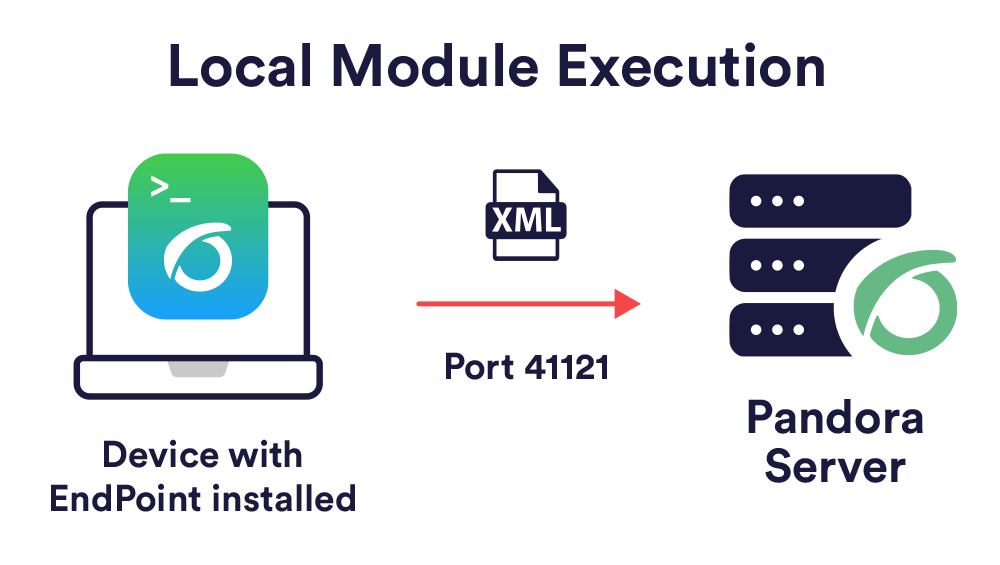
Generally, the monitoring of servers and equipment will be carried out with EndPoints, while the monitoring of network equipment will be done remotely without the installation of any software.
Topologies, Schemas, and Monitoring Models
Ideally, all monitored equipment should have communication with the Pandora FMS server, but occasionally we will encounter cases where we do not have full communication between the different elements we want to monitor. We are going to mention different situations we may face and how to fix them.
Accessible Networks
- Network accessible for centralized remote monitoring: The Pandora FMS server has communication with all machines on the network.
- Network accessible for Agent and EndPoint-based monitoring: It is the EndPoints that have communication with the Pandora FMS server.
Networks with Access Difficulty
- Remote network not reachable by Pandora FMS remote checks: Use the broker agent mode.
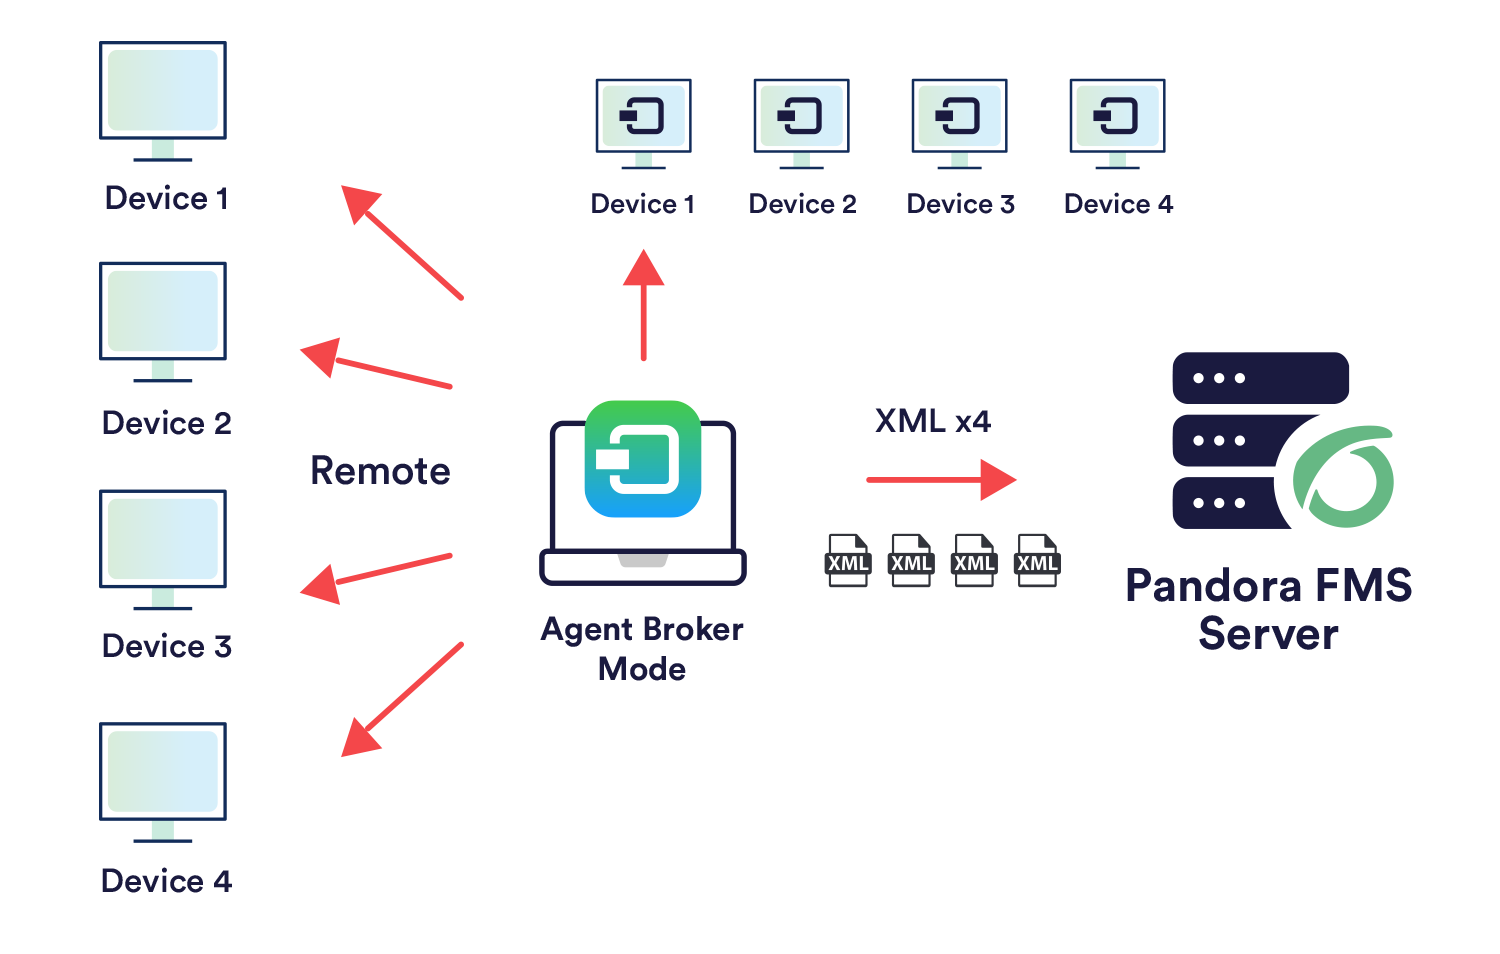
- EndPoints that do not have access to the Pandora FMS server: In this case, use the proxy feature of the EndPoints or a Satellite Server as an EndPoint proxy.

- Different networks to monitor remotely with the server: Satellite Server or several different Pandora FMS servers connected to the same database can be used.
Are the results explained in the chapter not being achieved? Access the help or support section
3. Installation
Cloud installation (online)
The term "Cloud provider" (or simply "Cloud") is used to describe the hosting of virtual machines, whether exclusive or shared, in specialized providers with hardware, hypervisors, and web-based customer service systems for their configuration and management.
For any of them, you can install Pandora FMS. Red Hat or Rocky Linux 9 is recommended as the operating system, with at least 4 gigabytes of RAM and 20 gigabytes of free storage space of the Solid State Drive (SSD) type.
For more information on alternative installation methods, you can consult the Pandora FMS Installation chapter of our official documentation.
Access the command line as provided by your Cloud provider and select your chosen operating system.
You can obtain the installation script and a free trial version at the following link:
https://pandorafms.com/en/free-trial/
Once the script finishes running, Pandora FMS will be installed and ready to use in its latest version.
First steps
After a few seconds, the terminal screen will show that it has finished and Pandora FMS will be installed. On this same screen, you will find the IP address or URL that the system has assigned to connect to the Pandora FMS Web Console.
Once the IP address of the Pandora FMS system is known, you can access it from a browser. Type the following address into it, composed of the IP address obtained:
http://x.x.x.x/pandora_consoleIf everything is correct, you will reach the Pandora FMS Web Console welcome screen, similar to this one:

Are the results explained in the chapter not being achieved? Access the help or support section
4. Detecting and monitoring new systems with Discovery
The Pandora FMS Discovery tool provides a set of features to simplify monitoring through wizards, including the Discovery Network Scan function.
To use it, the following steps must be followed. In the side menu: Management → Discovery → Host&Devices → Network Scan.
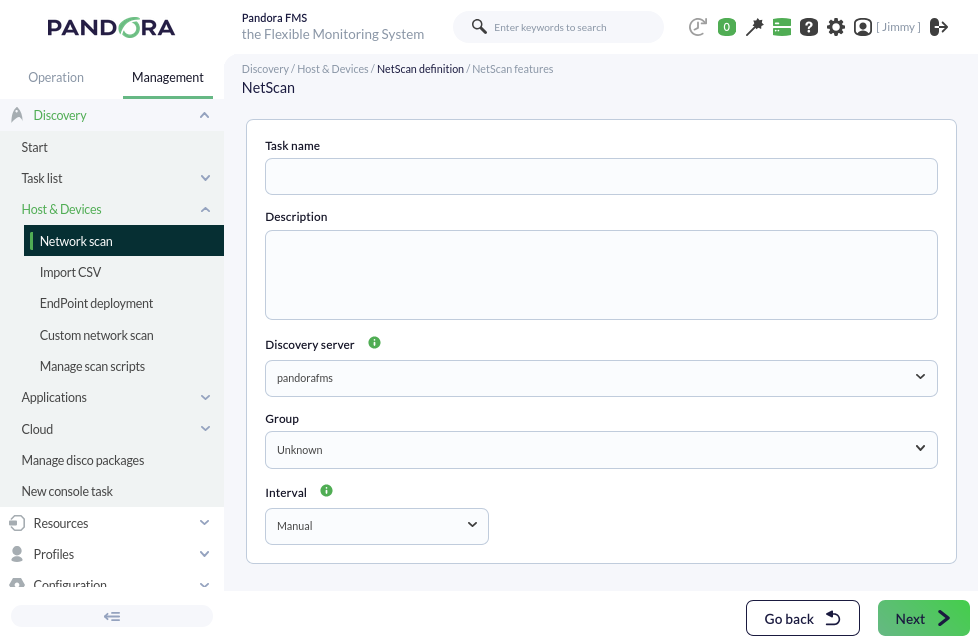
We will create the task as follows: Select the Unknown group, which will be used to contain the devices detected in that group, the Manual interval, and the default Discovery Server. From now on, we will generically call the devices managed and/or monitored by Pandora FMS "agents". Move on to the next step; by default, it will show simple scanning:
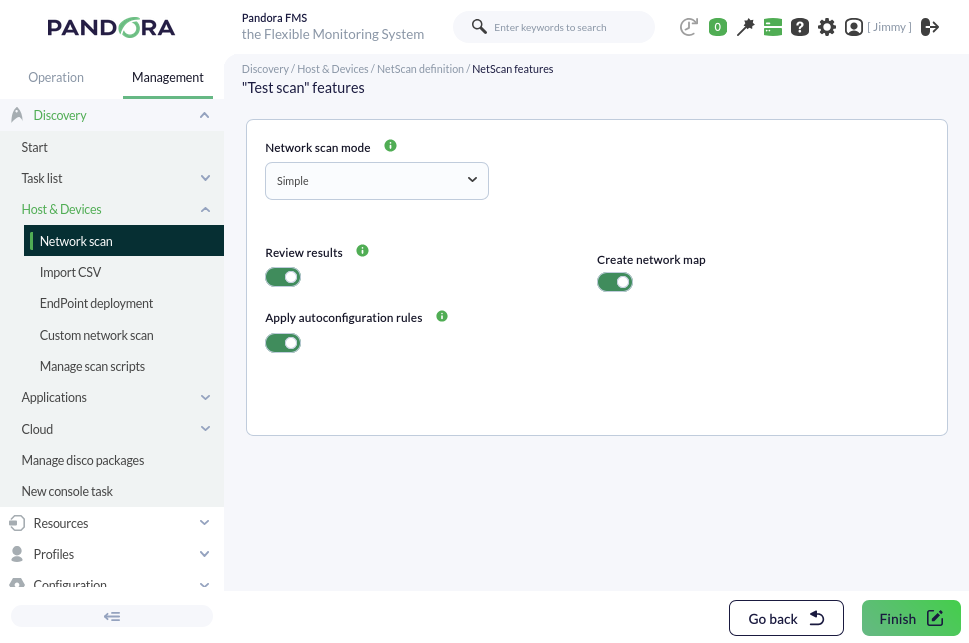
Although you can leave this option and save, it is better to specify a network to reduce the workload since, by default, all networks to which the PFMS Server has access will be scanned. To do this, choose the Advanced option.
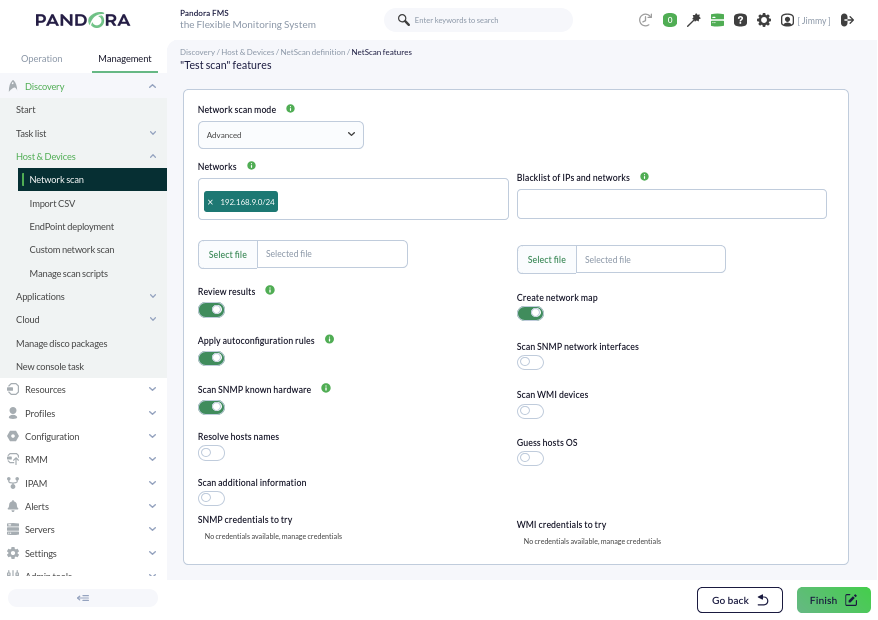
We can select different aspects of the initial monitoring that will be applied to the discovered devices. By default, the option to apply autoconfiguration rules (Apply autoconfiguration rules) is enabled as seen in the image. We will leave the Review results option checked. There are several more options that you can explore as you practice with the tool.
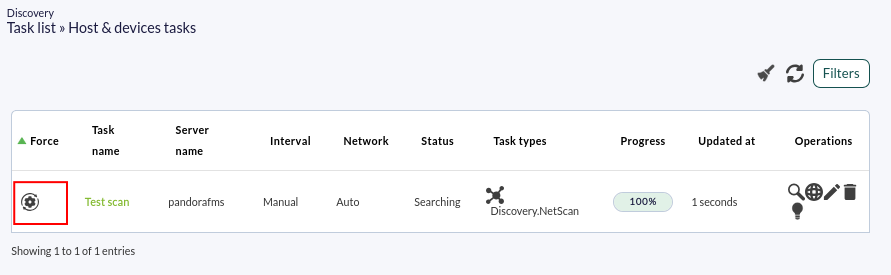
Once the reconnaissance task is created, since it was created with a manual interval, it must be started manually. To do this, in the discovery task list, force its execution:
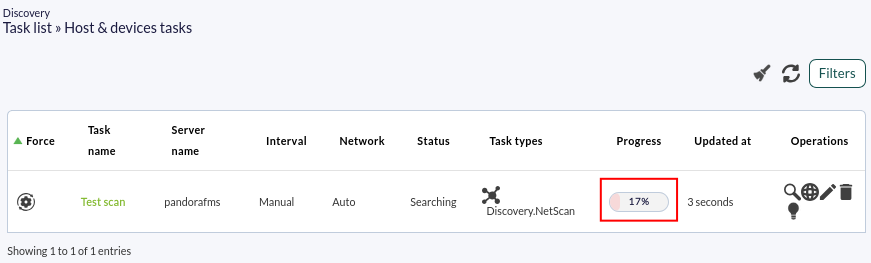
Its progress will be updated over time:
At any time, we can click on the magnifying glass icon to see the task details:
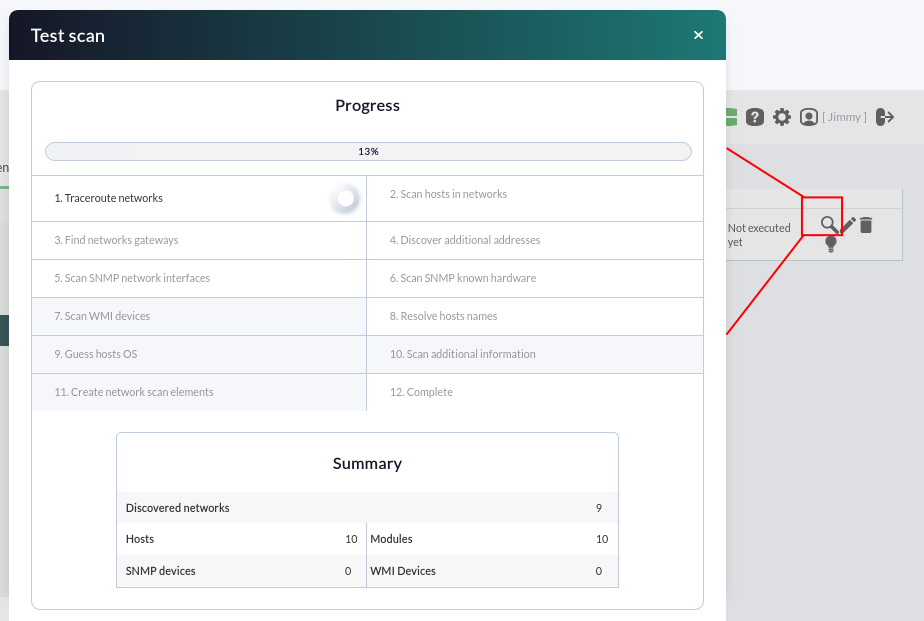
At this point, it is best to wait until the entire network has been detected.
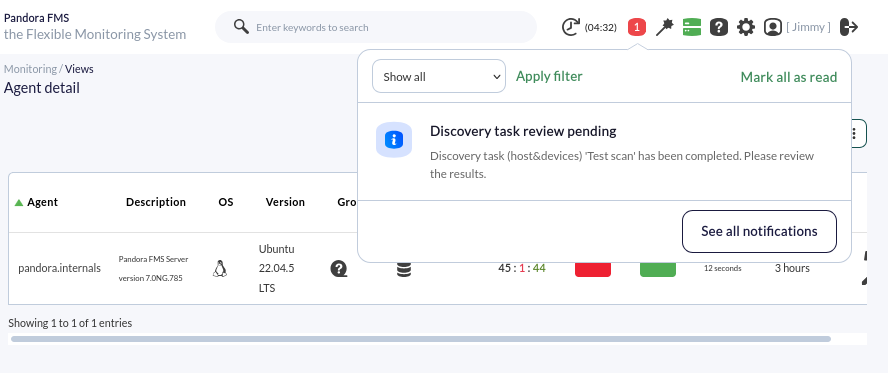
Even if other tasks are performed during the scan, and since we left the "Review results" option checked, if we have the notification system enabled, we will be notified in a timely manner:
A summary of what has been collected will be presented. You will see several systems that have been detected. In some cases, the system name will have been resolved (if possible via DNS) and in others, it will have detected the type of Operating System, according to the options selected in the network scan performed with Discovery. Each element will have its selection box to include those considered necessary:
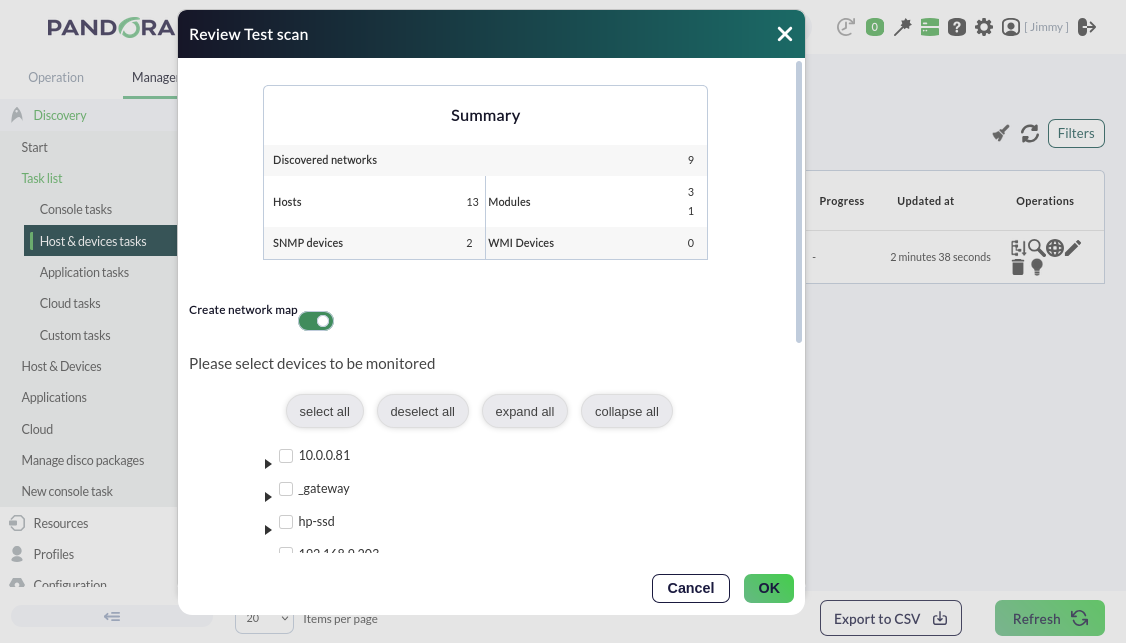
The basic checks are of the ICMP type: the "Host alive" module, a check that verifies the machine is "alive" and responding from the network, and the "Host Latency" module, which calculates the time the server takes to communicate with the machine. Select some of them, along with other elements you consider of interest. When you press OK, another pop-up window will appear with the selected elements:
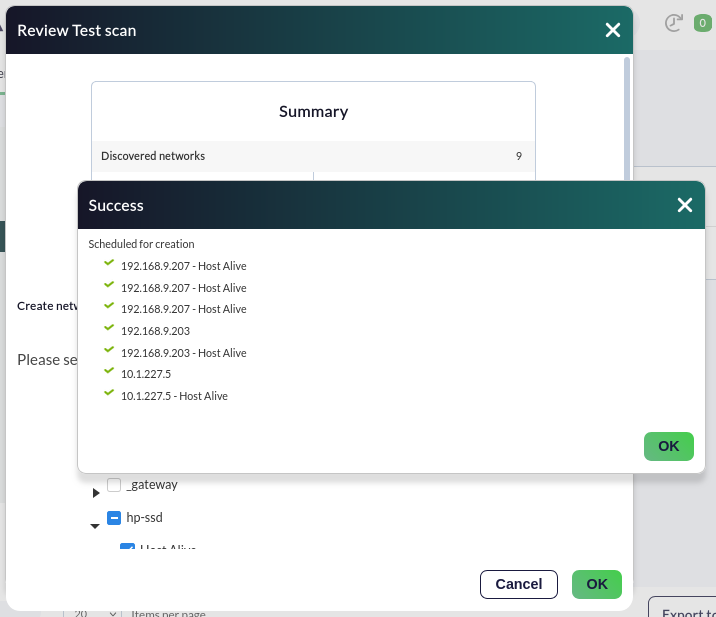
When finished, you will access the agent detail view to see all the detected and selected systems.
Menu Operation → Monitoring → Views → Monitor detail, filtering by the Unknown group:
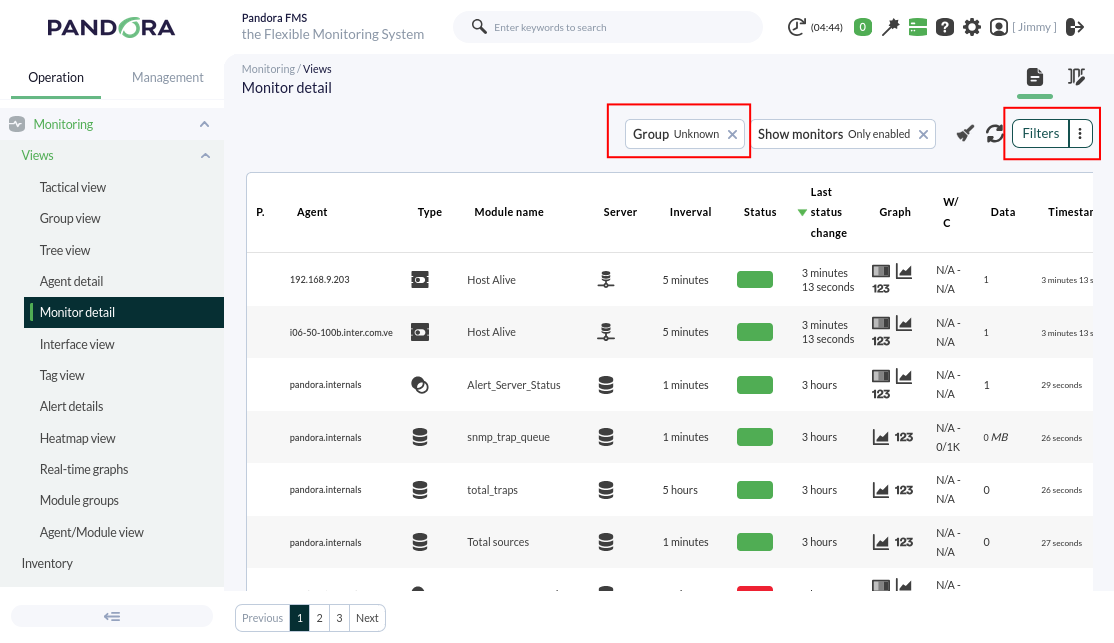
If you do not need further monitoring or configuration, let's move on to metric alerting here. Are the results explained in the chapter not being achieved? Access the help or support section.
5. Detecting and monitoring network and Windows devices with Discovery
Let's now look at a discovery task that is more complex than the previous one, this time configuring SNMP and WMI, two protocols used to remotely monitor both network devices (SNMP) and MS Windows® (WMI).
Menu Management → Discovery → Host & Devices → Network scan.

The configuration process is similar to the previous one, this time selecting the advanced mode, and we will access the discovery task configuration options at the bottom:
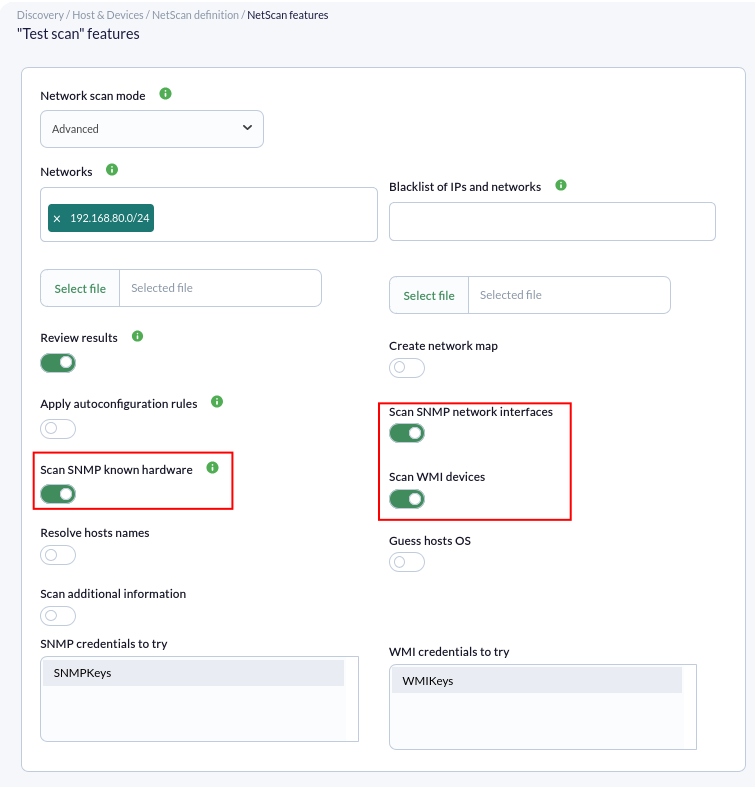
To enable monitoring with SNMP and WMI, we must activate the corresponding token and provide the data required by each protocol.
- SNMP uses "communities," which are like access passwords. If you do not know your SNMP community, try
public. You can enter as many as you like, and they will all be tested. - Credentials for the WMI service (and others) can be defined in Management → Configuration → Credential store.
The credential store is a secure vault for username/password pairs that are later used in remote checks, equipment configurations, remote access, etc. This allows them to be reused at different points within Pandora FMS:
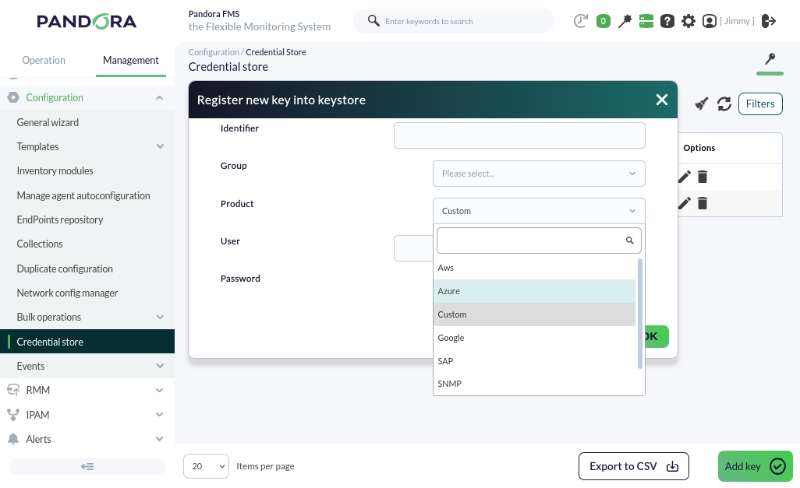
We will also enable the Review results token, which will allow us to see the components found by Pandora FMS in the discovery task once it finishes, displaying what has been found and allowing it to be added to the agent's remote monitoring with a single click.
If you do not need further monitoring or configuration, let's move on to metric alerts here.
Are you not achieving the results explained in this chapter? Access the help or support section.
6. Network device monitoring through SNMP Interface Wizard
To perform this type of monitoring, it is essential that SNMP is configured on the remote device. This generally needs to be activated with a minimum configuration that allows data queries.
SNMP devices allow you to configure which IP addresses can perform queries and which community will be used for those queries.
Most network devices (routers, switches) have the community public by default.
For this monitoring, an agent will be created via the menu Management → Resources → Manage agents → Create agent, with the following configuration:
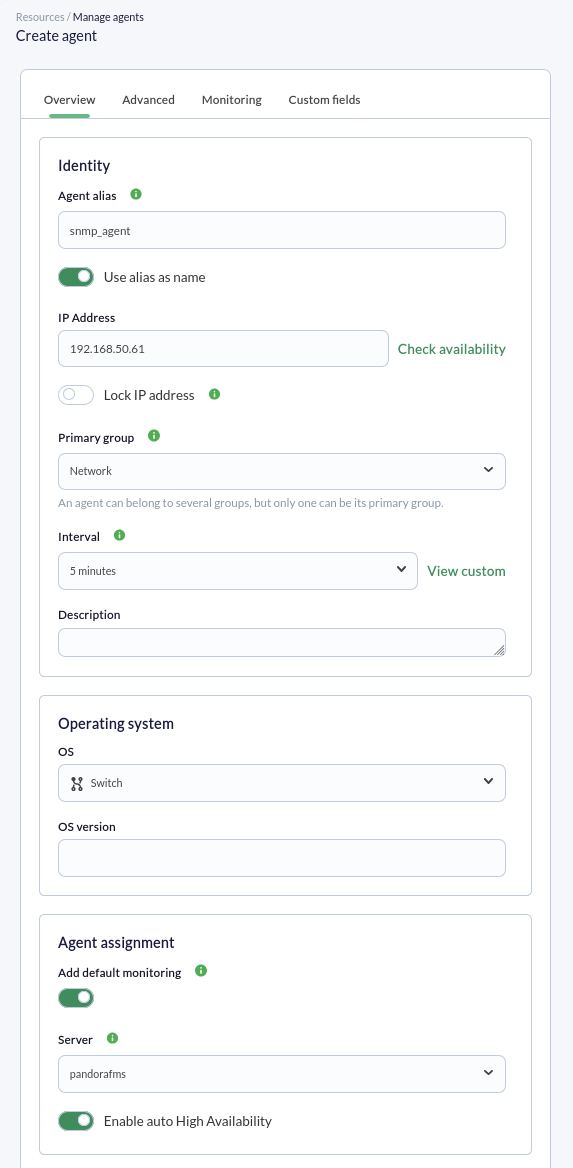
Important fields include IP Address, where the IP address of the remote SNMP device to be checked will be entered. Generally, this IP address is automatically used when modules are created, but you should always verify that this IP address has actually been used in each module. In the Add default monitoring field (active by default), we will see this feature in action: two modules will be created, one to verify connectivity—in this case with the switch—and the latency or connection time (speed). Click the Create button to save.
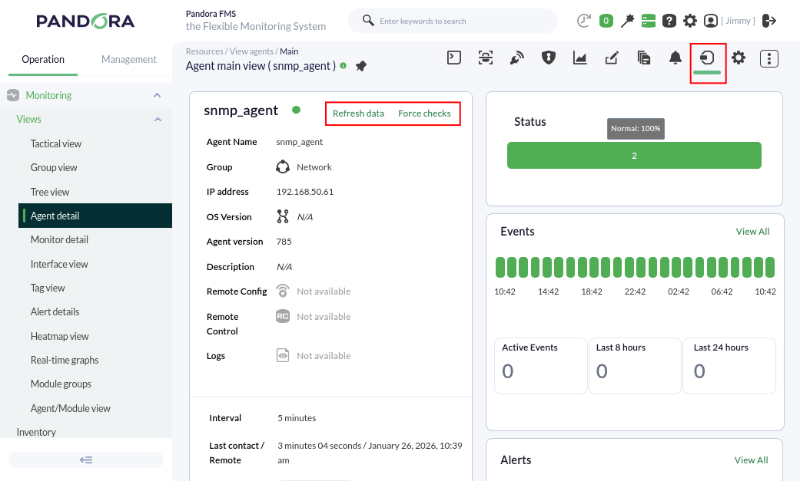
Once the agent is created, go to its main view (Main tab), and in a few moments, you will see if there is a connection to the device. If necessary, you can force the check and refresh the data (Force checks and Refresh data buttons):
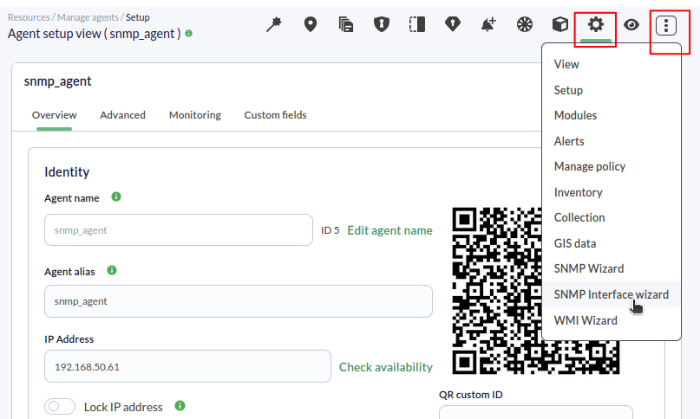
Now we will go to the Manage tab, which allows access via the drop-down menu to the SNMP interface wizard option (this option is also available in the first tab from left to right):
When accessing the SNMP wizard for network interfaces, the following dialog box will appear where the IP address (Target IP field) has already been inserted, brought from the agent's general data, and a previously stored SNMP credential has been selected (Import from credential store field):
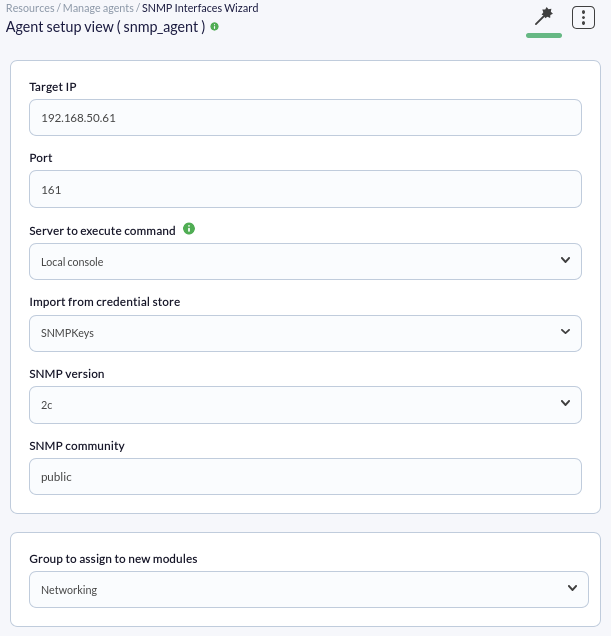
This stored credential also provides the SNMP version and its community. Finally, we select the Networking group to assign the new modules and click the SNMP walk button. This may take some time depending on the device's complexity; once the scan is complete, we will look at the box that allows adding general checks to the detected network interfaces.
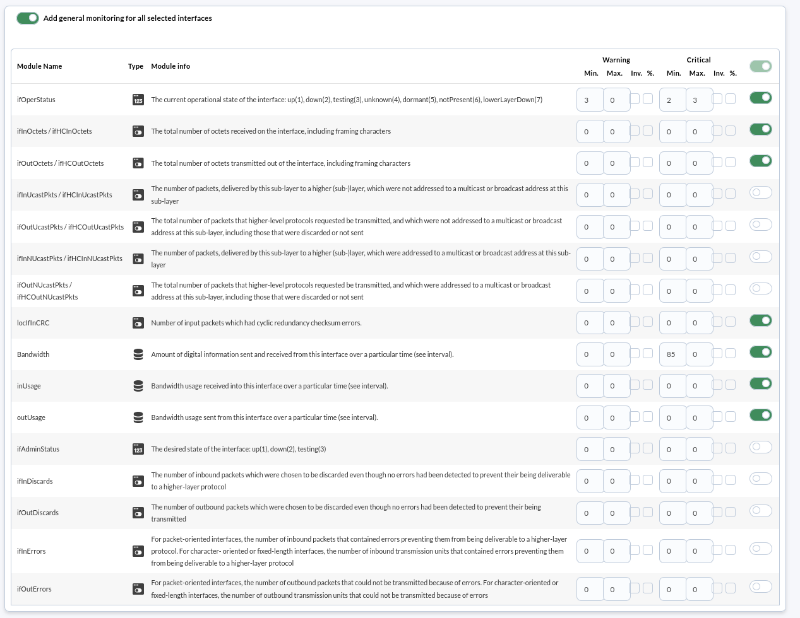
We will leave the values already checked and click the Create modules button, after which a dialog box with a summary of the modules will be presented:
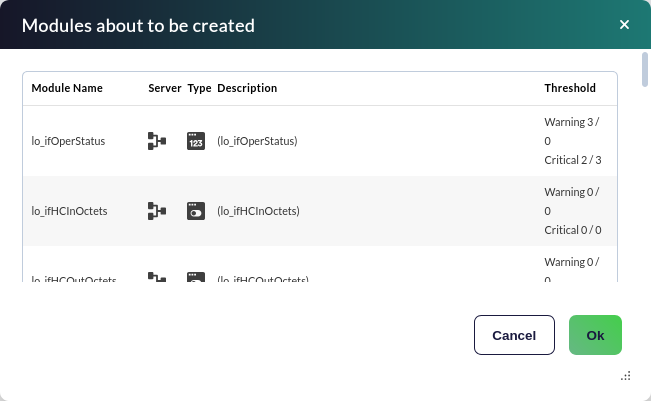
Upon clicking the Ok button, the modules will be created in the agent.
Network traffic modules are of the incremental type, meaning their value is the difference between the information sample just collected and the previous one. It shows a "rate" (in this case in bytes/sec), so it needs some time (between 1 or 2 agent intervals) before it can display consistent values.
Once monitored for a sufficient amount of time, go to the menu Operation → Monitoring → Views → Monitor detail and in Filters search for the agent group and the normal status:
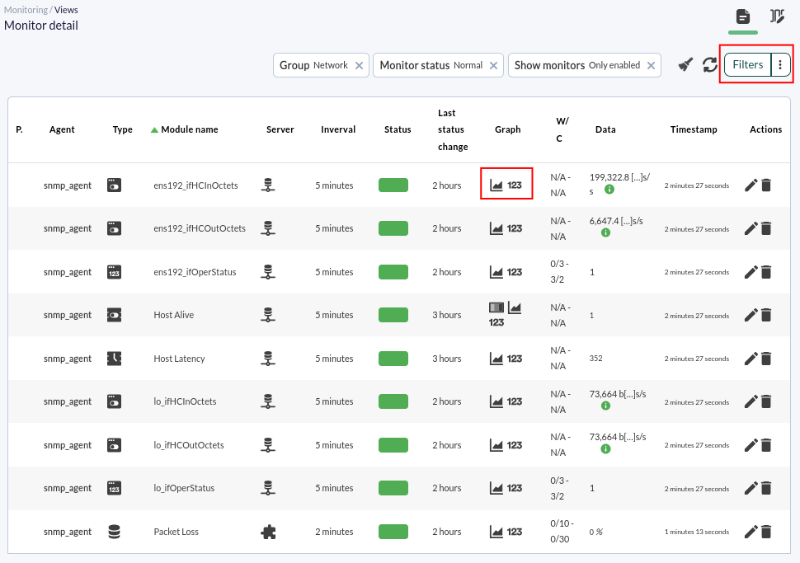
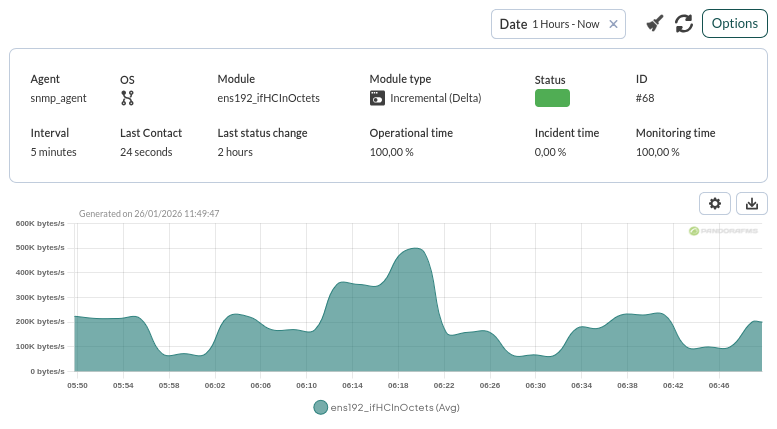
Let's look at a graph of just one of the individual metrics:
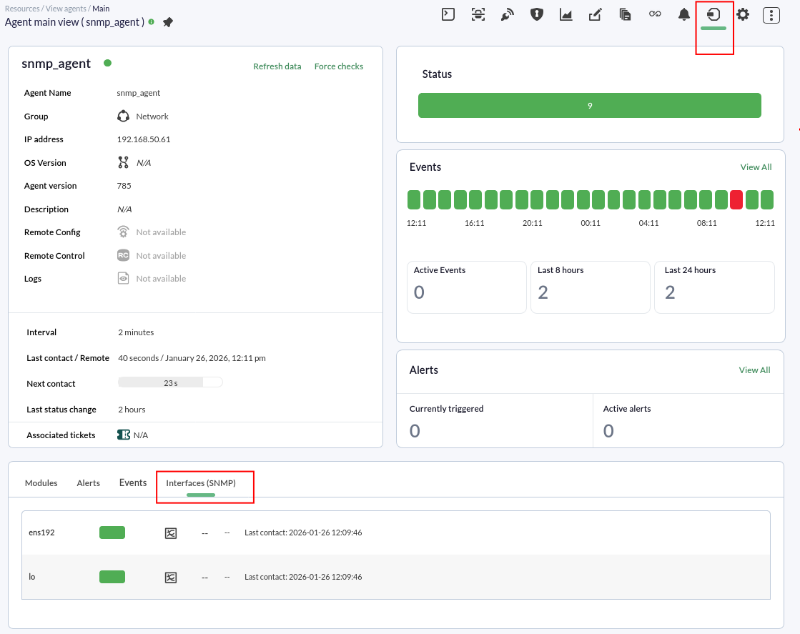
We can also use the Interface information (SNMP) view, located below the general agent view, to conveniently see the input/output traffic information for each interface:
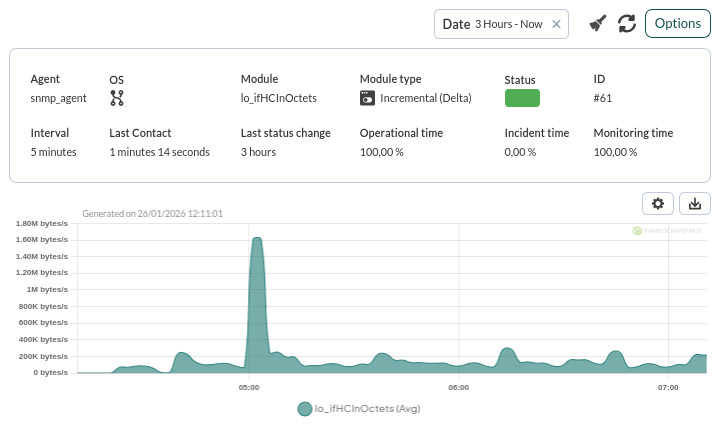
By clicking on the graph icon of an interface ( ) you will see more details (in Options you can change the time period):
Are you not achieving the results explained in this chapter? Access the help or support section.
7. Network device remote monitoring
Monitoring through network modules. TCP Service
In this case, monitoring will be added to verify that an SMTP (email) service is active on a machine. Although this can be a very complex check (simulating the sending of user credentials and passwords, sending an email, etc.), it will be simplified here by only verifying that the port is open and responding.
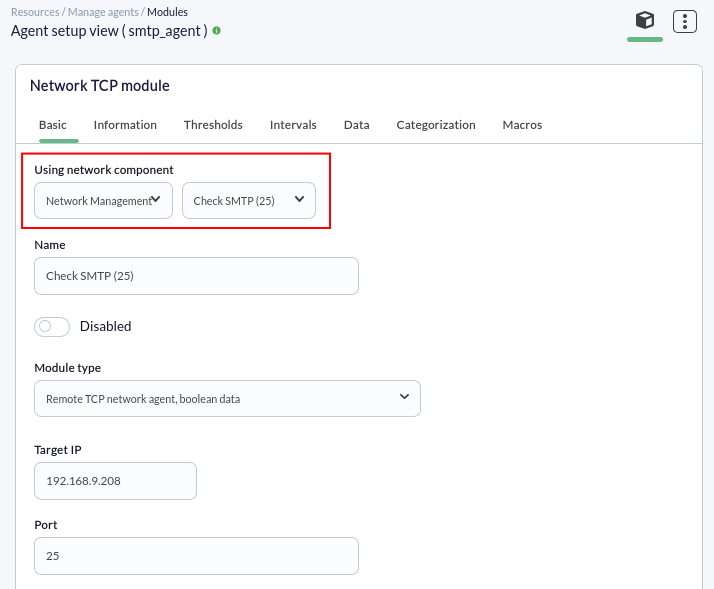
To do this, some steps from the previous chapter will be repeated: first creating an agent and then creating a network module (Network TCP module):
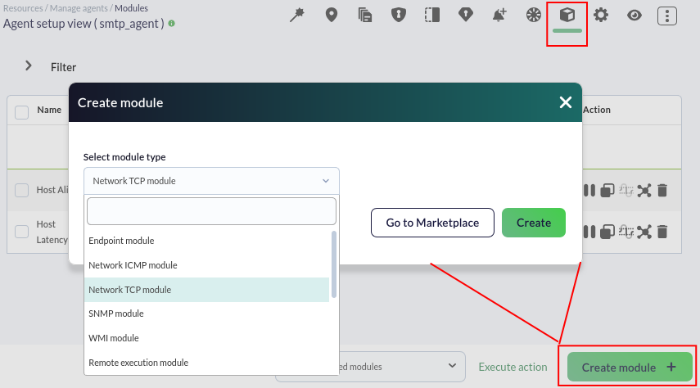
Next, use the drop-down controls until the desired check is found, Check SMTP (25), and click to create the module (only necessary fields are shown; ensure it brings the agent's IP address):
Finally, the steps will be repeated (go to the operation view and refresh until the monitor appears). Until a module has data, it will be BLUE, indicating that it has not yet been initialized:
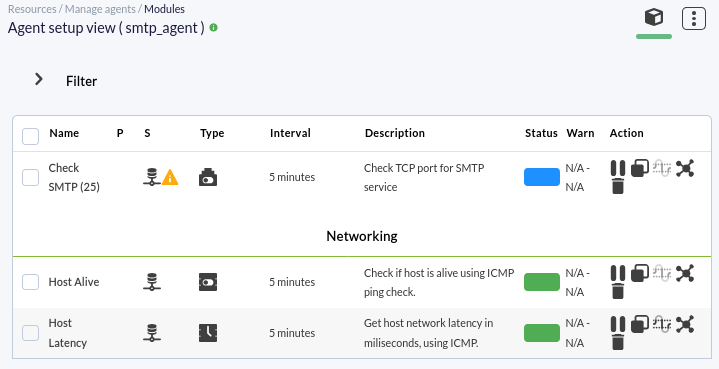
After a few seconds, it should start and take a value: GREEN if the SMTP server responds, or RED if it does not:

Monitoring through server plugins. Network packet loss
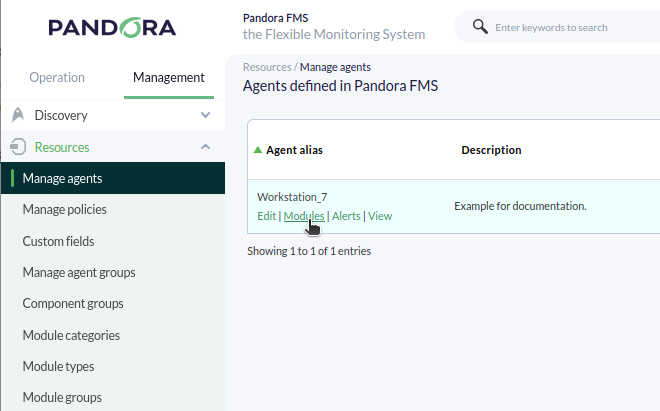
We are going to monitor network packet loss using a remote check that comes preconfigured in Pandora FMS. To do this, go to the agent administration view, as we will measure packet loss from Pandora FMS to the IP address of any agent.
And we will create a module of the Plugin type:
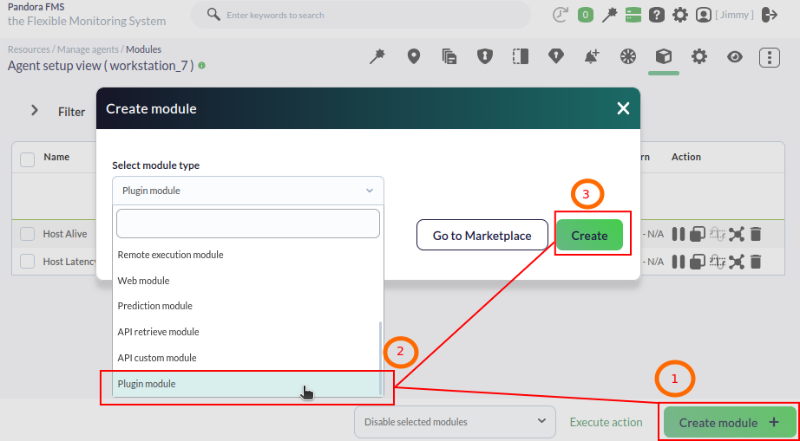
Select the Network management component group and search for Packet loss:
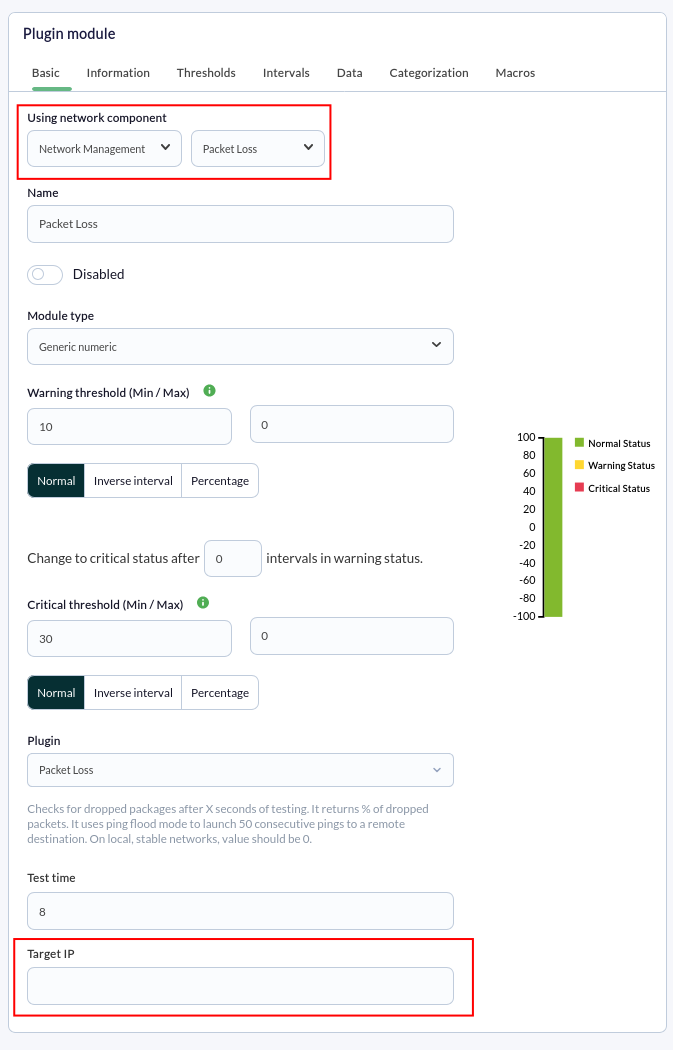
You must enter the IP address of the device to be monitored in the Target IP field before saving the new module.
Go to the main agent view; initially, the module will be displayed as uninitialized in blue:
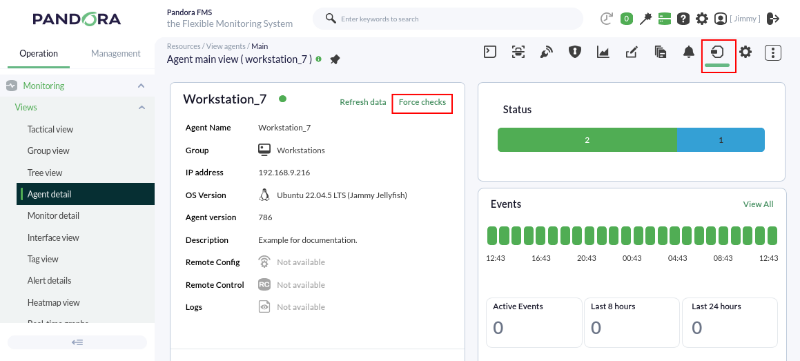
To speed up the process, you can force all checks (Force checks button) for the agent in question.
The round icon is to force only the check of the new module:
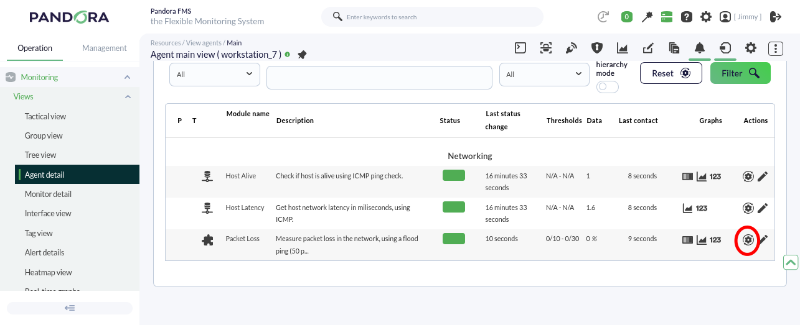
Just to the left of the force module check button, we have the graph and data table icons respectively. These are used to display an interactive graph or a table with the data collected by that module. All modules with active history have the option to view graphs or data:
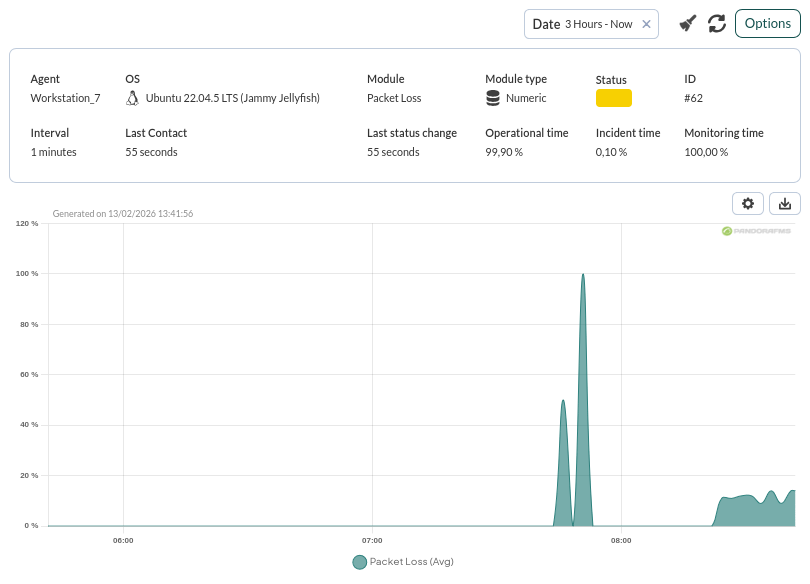
This is a very interesting plugin; when used in conjunction with basic connectivity (ping) and latency time, it serves to determine the quality of your network, as it indicates the percentage of packet loss.
Are you not achieving the results explained in this chapter? Access the help or support section.
8. Web Monitoring
For this final example, we will use the Pandora FMS web server component, which is used for basic HTTP and HTTPS monitoring. This element allows us to perform simple or slightly more complex web checks (in various cases) using low-level calls. It is useful for ensuring our pages remain online, verifying that we can perform a series of steps (for example, filling out certain forms), and/or checking that they contain a specific word. In addition to verifying that they work, we can measure the total time they take.
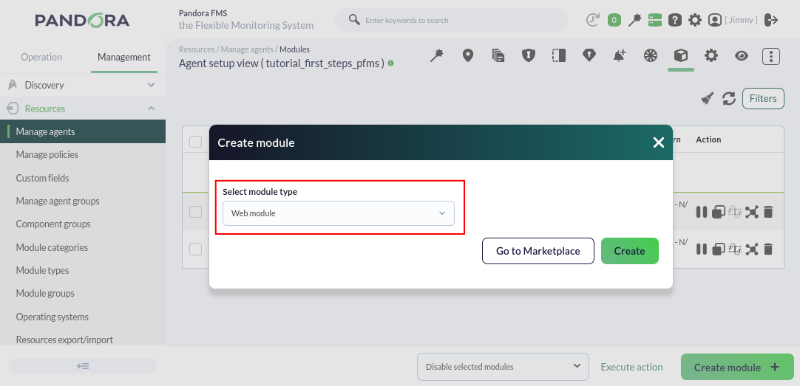
To create this type of module, we must choose the Web module type during the module creation process:
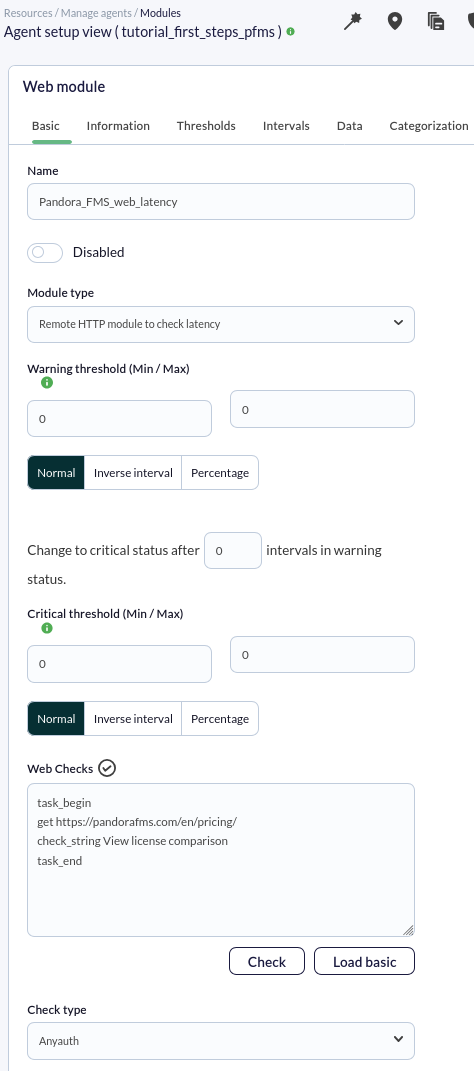
Once we click the Create button, we will see a form where we must fill in the necessary fields to monitor a website. The most important thing will be choosing the type of check. We are going to create a module that allows us to check a website's loading time and ensure it contains the phrase "View license comparison".
To do this, we will select the module type Remote HTTP module to check latency, which will allow us to see the number of seconds the server takes to respond.

In this case, we will make only one request and verify that the response returns a specific phrase; to do this, we will add the following code to the Web checks box:
task_begin
get https://pandorafms.com/en/pricing/
check_string View license comparison
task_end The check will appear as follows:
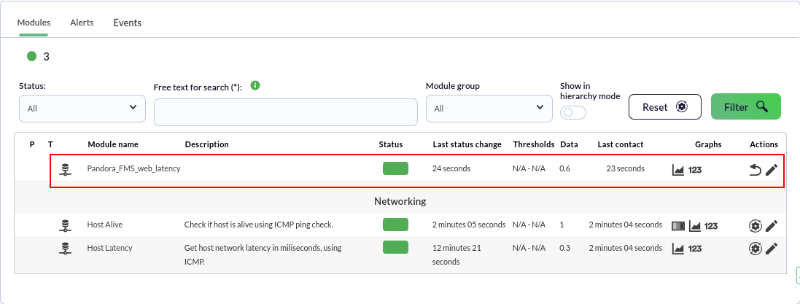
As always, after a few seconds, we will have received some data from this module—in this case, the number of seconds it takes for the request to complete:
Pandora FMS also offers the possibility of monitoring complex web transactions thanks to the Web User Experience, which is a more advanced functionality.
Are you not achieving the results explained in this chapter? Access the help or support section.
9. Remote Server Monitoring
Pandora FMS also offers us the possibility to monitor computers using Linux® or MS Windows® operating systems remotely without the need to install an EndPoint.
To achieve this, we will need to create remote execution modules that allow us to query the device from our Pandora FMS installation by executing a command remotely and obtaining the desired result. For security reasons, authorized user credentials are required for each operating system, so we will first use the Credential Store functionality in PFMS and then create a remote execution module for each mentioned operating system.
Credential Store
The credential store saves sets of user/password so they can be reused in different checks, and whose data is not shown in the check configuration.
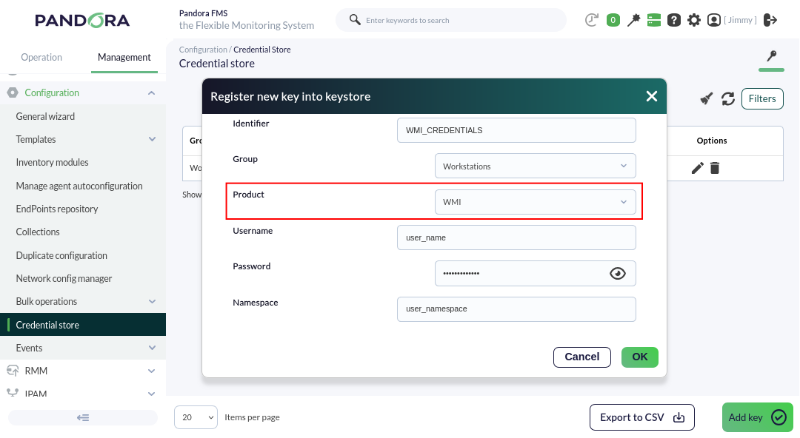
Through the Management→Configuration→Credential Store menu, you can access this functionality and must click the Add key button.
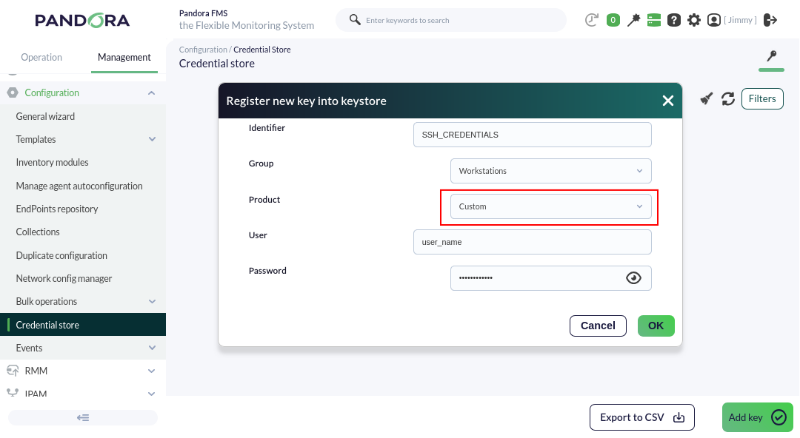
First, we will create a credential to connect to a GNU/Debian® (Ubuntu®) computer via SSH:
And then we add a credential for an MS Windows® computer via WMI:
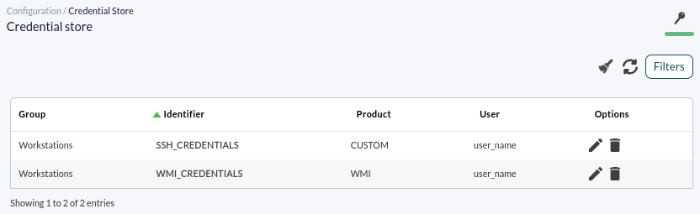
Our credentials should look similar to this:
Remote execution modules
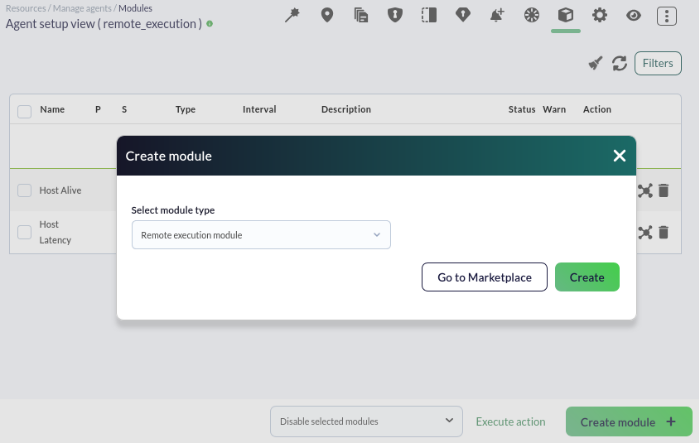
Create a remote execution module on the desired agent:
For the module type, in this case, we will choose the one corresponding to numerical data, Remote execution, numeric data:
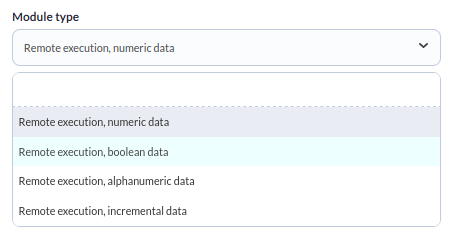
If you want to monitor something that returns a true or false state, such as a process status, you just need to ensure that your command returns 0 for a failed value and a non-zero value for a correct one. You must use a Remote execution, boolean data data type so that Pandora FMS interprets it as such and omits the use of any thresholds.
Now we are going to configure the check itself and add the commands to be executed to find out the number of processes or tasks that remote computer is running. This value is one of the indications of the workload being performed by the machine in question:
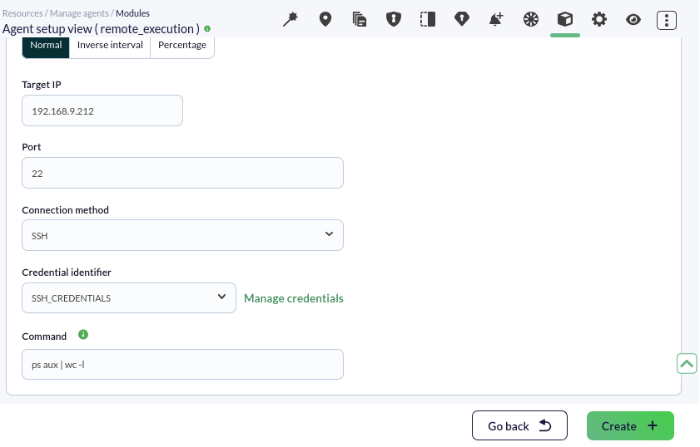
Note that:
- The IP address or URL of the computer to be checked must be entered. This is independent of the IP address that may have been added, if applicable, to the agent containing the module in question.
- Select the appropriate credential in Credential identifier.
The commands to use are:
For Linux®:
ps aux | wc -lFor MS Windows®:
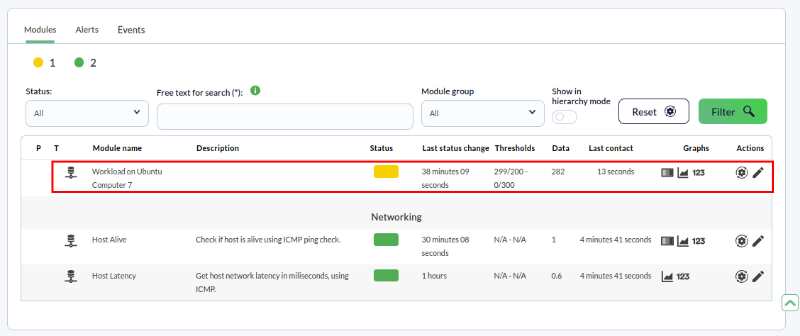
tasklist | find /C /V ""Lastly, we will establish the warning and critical thresholds. Since the workload a computer can handle depends intrinsically on the hardware used, for instructional purposes we will arbitrarily set 200 to 299 for warning and over 300 to declare the monitored device in a critical state.
We save the module and in a few minutes you will have information similar to the following:
Are you not achieving the results explained in this chapter? Access the help or support section.
10. Server Monitoring through EndPoints
MS Windows®
The first step is to download the EndPoint installer for MS Windows®. To do this, go to the downloads section, menu Management→Downloads→EndPoints→Windows 64 bits:
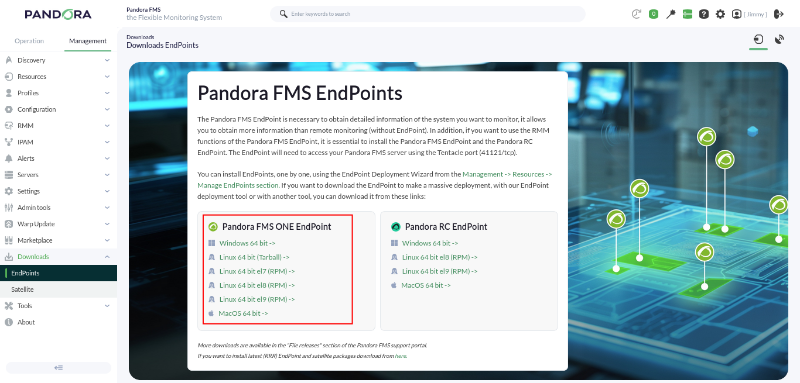
All available versions of the Pandora FMS ONE EndPoint can be downloaded from the following link:
https://packages.pandorafms.com/pandorafms/latest/
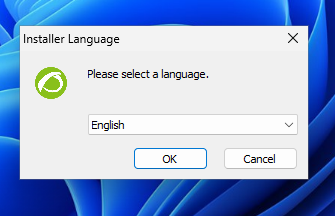
Once the agent is downloaded, run it by double-clicking on it (you must have administrator permissions) and the typical installation screen will appear, where you will accept all the steps:
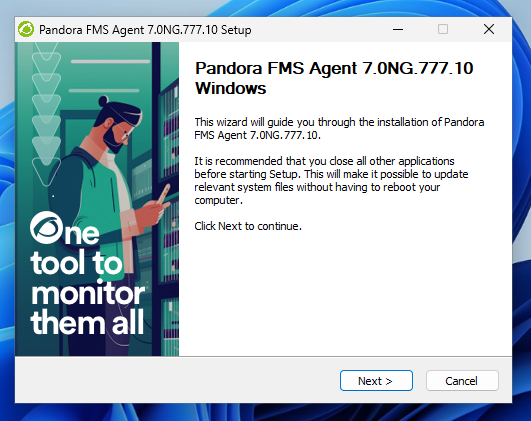
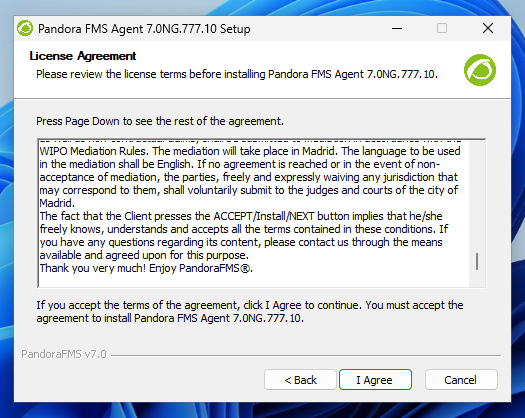
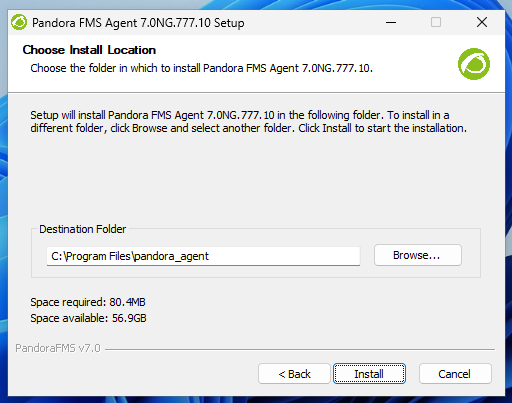
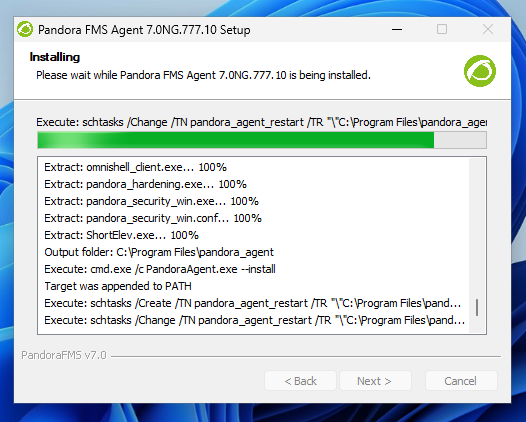
On this screen, you must configure the IP address (or name) of the Pandora FMS server that will receive the agent's data and the group you want the agent to be associated with. This group must exist in Pandora FMS.
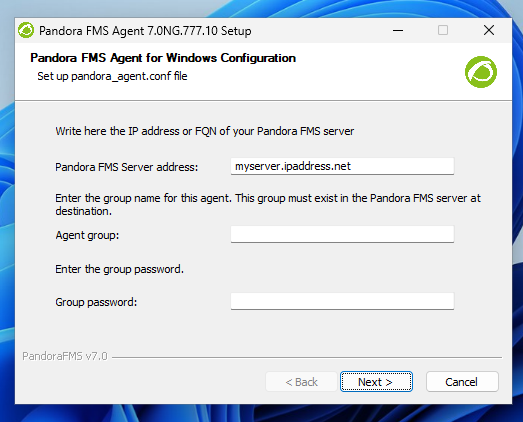
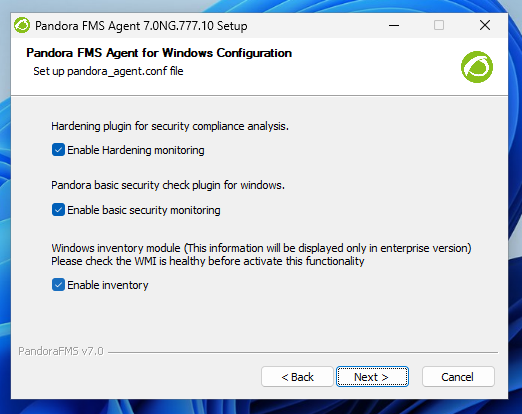
The option to enable remote configuration will appear. It is important to have it activated by clicking the checkbox to remotely manage this agent's configuration and avoid having to edit files manually. Additional security functions can be enabled:
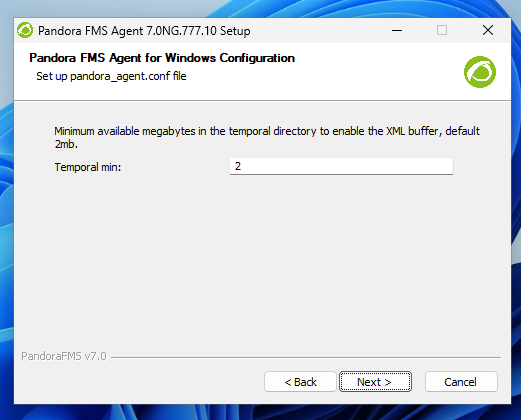
And also configure the minimum space necessary to locally save the result of the checks before they are moved to the respective PFMS Server:
To finish the installation, you can start the EndPoint service at the end of the installation; in any case, it will run when MS Windows® restarts.
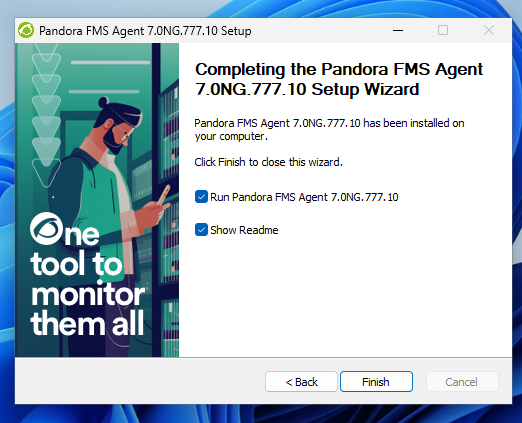
Once this process is finished, the EndPoint for MS Windows® is installed and running on the computer. In a few seconds, we should be able to see the agent reporting in our Pandora FMS console.
If you do not see the agent in the Web Console: Check that there is a connection between the agent and the IP address of the server you configured in the EndPoint.
EndPoint communication to the server uses port 41121/TCP.
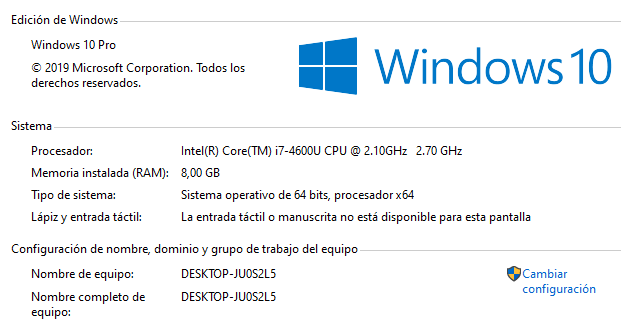
Once the EndPoint for MS Windows® is started after installation, it's time to check what this agent is reporting. To do this, you must know the name under which this agent will report. By default, the agent is created with the computer name, as seen in "System Information" (in this case DESKTOP-JU0S2L5).
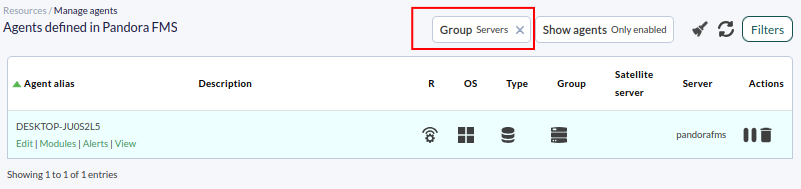
Once you know the EndPoint name, the next step is to see if it has been created in Pandora FMS. For this, you have several options. The first one is to search in agent details, within the group in which the agent was created, in this example the Servers group:
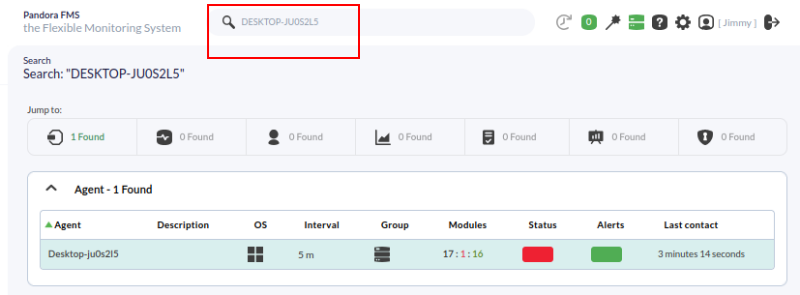
A faster and more efficient way to find the agent is to search directly through the Pandora FMS search bar at the top of the page, where you can enter your computer name or part of it:
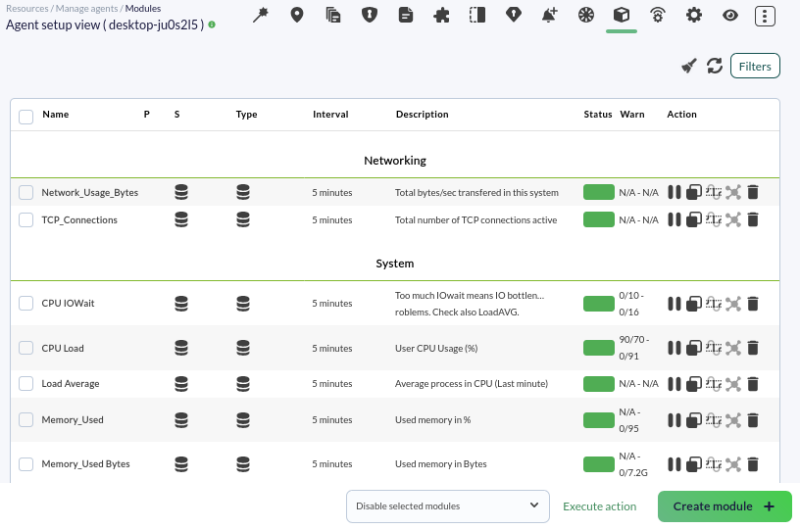
By default, the EndPoint for MS Windows® comes with several pre-loaded local modules for basic monitoring, such as CPU load, percentage of free RAM memory, etc.:
If you need to add new modules to this agent, you can consult the advanced documentation for EndPoint monitoring.
You can view graphs generated with the module's historical data and a table with their history from this view by clicking on the icons marked in the following capture:

It is important to highlight that remote monitoring and EndPoint-based monitoring can be performed on the same agent; you can combine both types of monitoring, resulting in much more complete monitoring.
Linux®
Monitoring a GNU/Linux® server is just as simple but requires doing it from a command terminal. You can either download the package corresponding to your Linux® distribution (or the self-installing tarball). There is also the option to install via an online installer:
Online installation of the PFMS EndPoint
The necessary configuration to set up the Linux agent can be found in the file:
/etc/pandora/pandora_agent.confOnce configured, you can start the service:
systemctl pandora_agent_daemonOr if your operating system (Devuan, etc.) does not use SystemD:
/etc/init.d/pandora_agent_daemon startFor MS Windows®, there is also a file with the same name in the directory where the PFMS EndPoint was installed, and you can edit it with a standard text editor. The configuration tokens are exactly the same for the EndPoint/Linux® as for the MS Windows® agent, except for some tokens that are specific to the MS Windows® EndPoint.
These are the default modules that report data in a Linux® EndPoint:

Are you not achieving the results explained in the chapter? Access the help or support section.
11. Module Advanced Settings
In this section, we will see how to configure some of a module's advanced options, as well as define the measurement thresholds that cause a module to transition to a WARNING or CRITICAL state. When editing a module, you can also define many other settings that allow you to fine-tune each metric monitored by Pandora FMS to your needs.

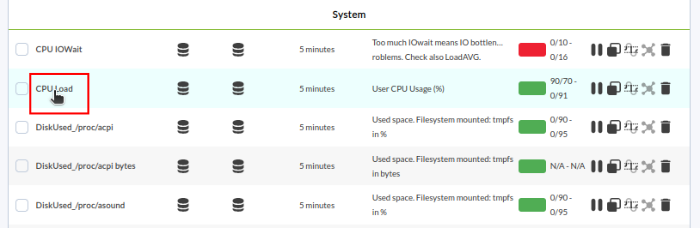
We choose the module we want to configure by clicking on its name:
In this view, we will find the fields necessary to adjust the warning and critical thresholds. In this example, we are editing the CPU Load module, a module that returns a numerical value (as seen in the module type information, it is a Generic numeric or generic_data).
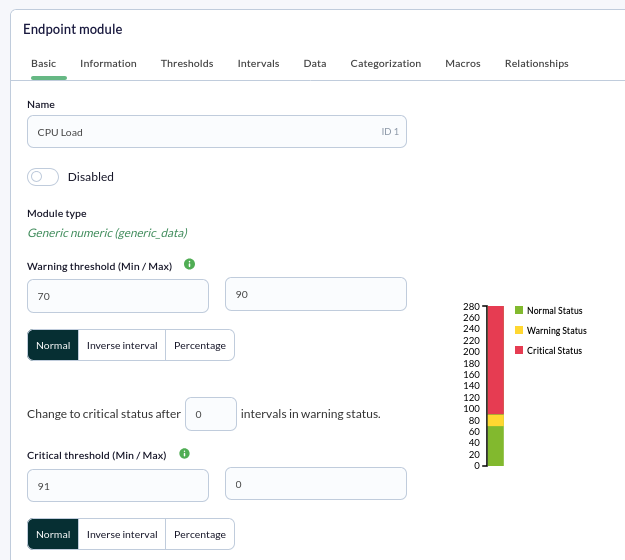
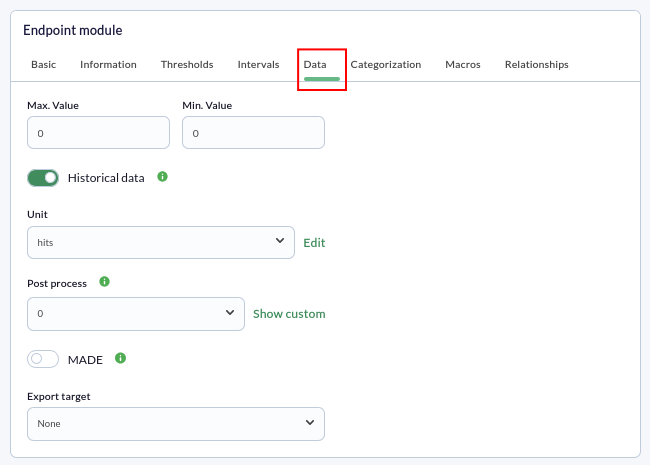
Other fields of interest include the Disabled checkbox to deactivate the module, or the module group definition list it is assigned to, which serves to classify an agent's modules so they appear grouped. Finally, the Historical data checkbox allows defining whether this module saves all information it receives (to display historical graphs) or only the last collected value.
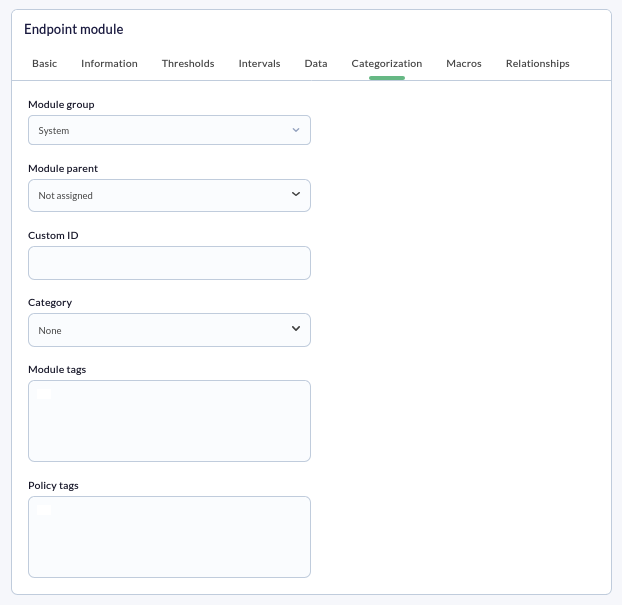
We will also see some other interesting fields in the Categorization tab:
Thresholds
In this section, we will configure the warning and critical thresholds for a module, which define what values a module must have to be in a CRITICAL, WARNING, or NORMAL state. Let's see an example:
In our example, we have a CPU % module to which we want to add thresholds. This module, by default, will always be in a NORMAL (green) state as long as it is between 0% and 100%.

If we want this module to show a critical or warning state when the CPU reaches a certain percentage, we must configure it by determining the desired Warning threshold and Critical threshold. In this example, we will configure them so that when the CPU reaches 60% usage, the module enters a warning state, and if it exceeds 80%, it enters a critical state.
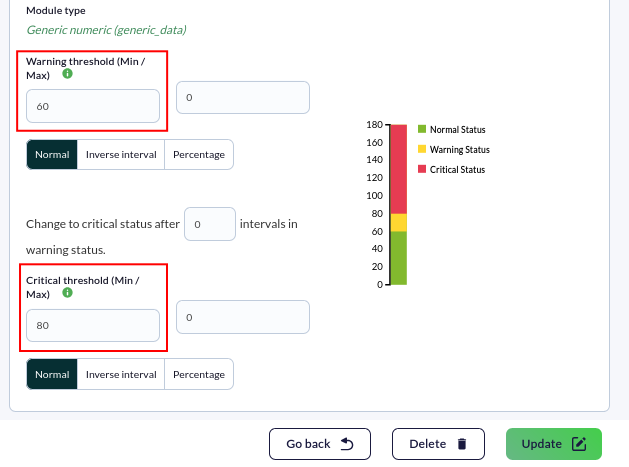
After configuring the thresholds, we just need to click the Update button, and our thresholds will be correctly configured. The next received data will already interpret those thresholds.
Units
This field within the advanced options allows defining the units of the data obtained in a module. This unit will be included in graphs and reports, making it easier to interpret the data shown to the user.
In our example, we want the unit to be hits. We place ourselves inside the Unit field and choose the desired option from the drop-down menu:
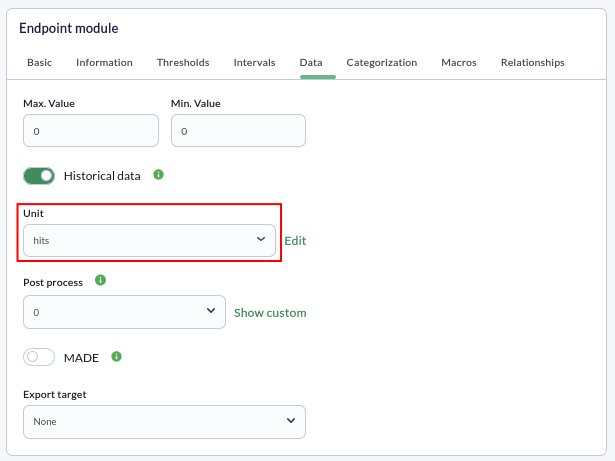
Finally, we click the "Update" button and verify that our unit is correctly displayed in the modules view.
If the unit does not appear among those available, we can define one by clicking on the pencil icon.
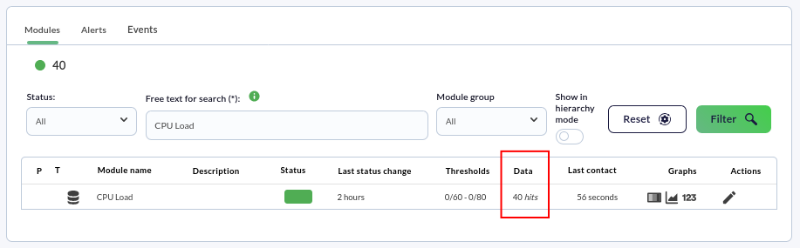
Are you not achieving the results explained in this chapter? Access the help or support section.
12. How to use Pandora FMS plugins
Plugins allow Pandora FMS to obtain information that requires complex processing or the use of complex systems or APIs. Examples of plugins include MySQL® database monitoring or packet loss between devices.
This quick guide will show examples of plugins that are included by default in Pandora FMS. There is also the possibility of creating our own server and EndPoint plugins.
Server Plugins
Pandora FMS includes several ready-to-use plugins by default. To view the server plugins registered in Pandora FMS, go to Management → Servers → Plugins. These types of plugins only return a single value.
These plugins are stored in the /usr/share/pandora_server/util/plugin/ directory and are executed by the PFMS Server.
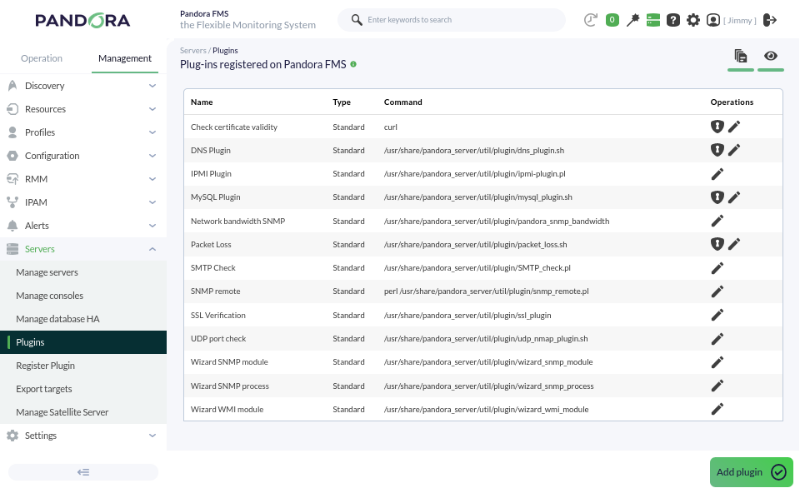
To use these types of plugins, the plugin server must be enabled in the /etc/pandora/pandora_server.conf file under the heavyserver 1 token.
To create a remote plugin-type module, access the agent editor and go to the Modules tab:
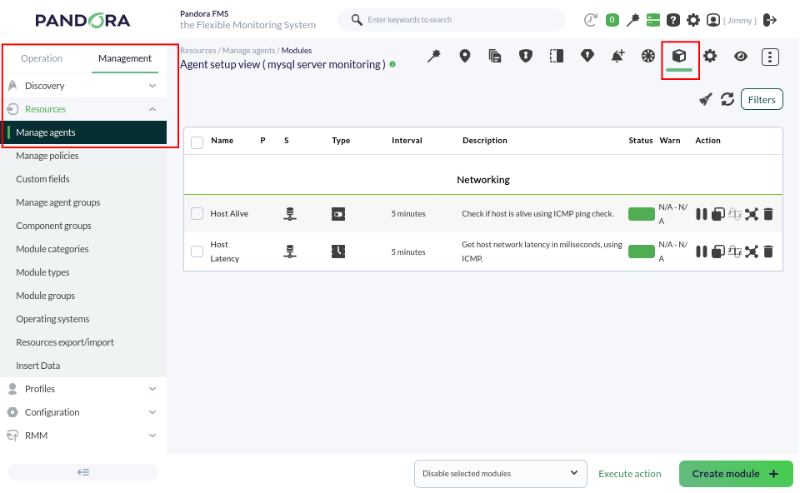
Create a Plugin module:
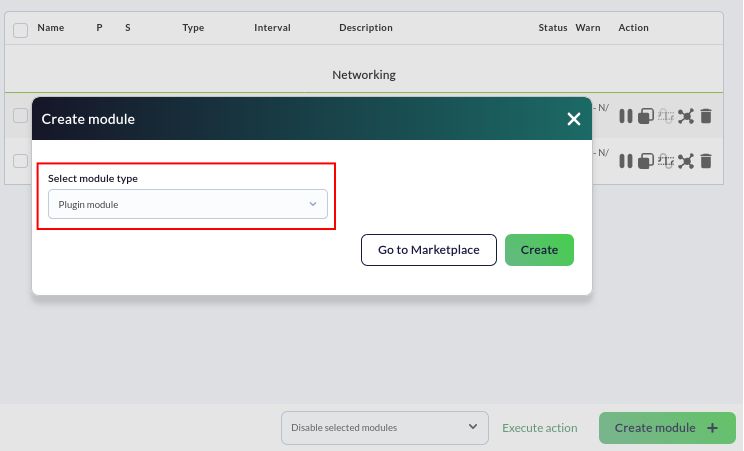
It is generally configured in the same way as any other type of remote module. In this module type, we have a Plugin drop-down menu that allows us to choose the plugin to be used.
In this example, the Packet Loss plugin is used to check the amount of packets lost over a period of time between the server and the destination.
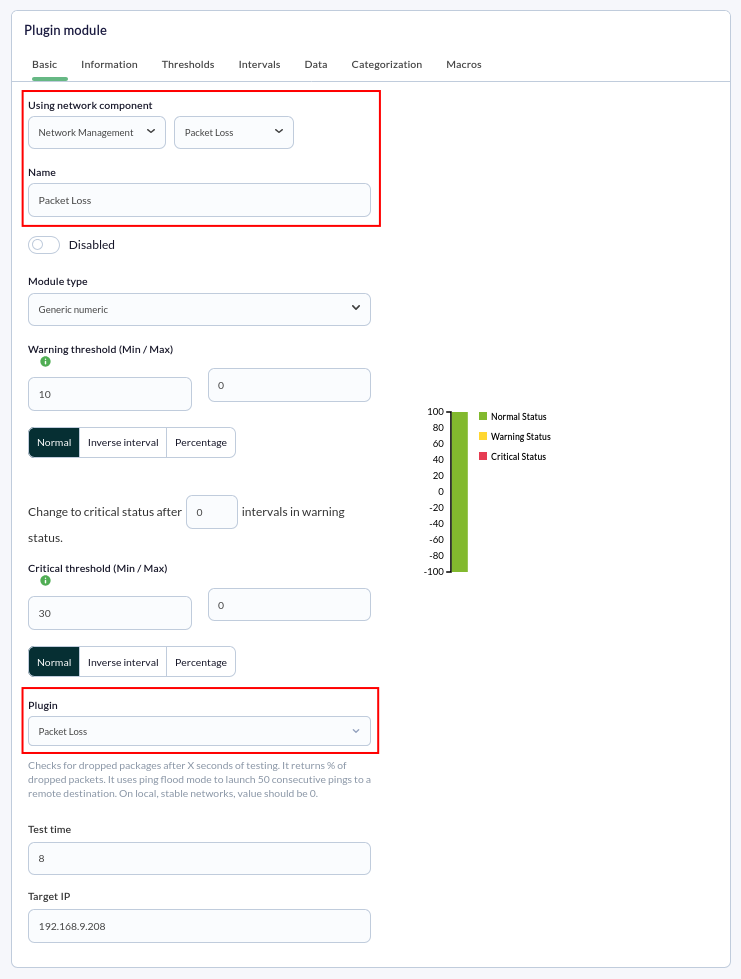
Fill in the fields with the necessary information; for the Packet Loss plugin, we define the test time and the destination IP address.
A few seconds after creating the module, the module and its obtained value will appear in the agent view:
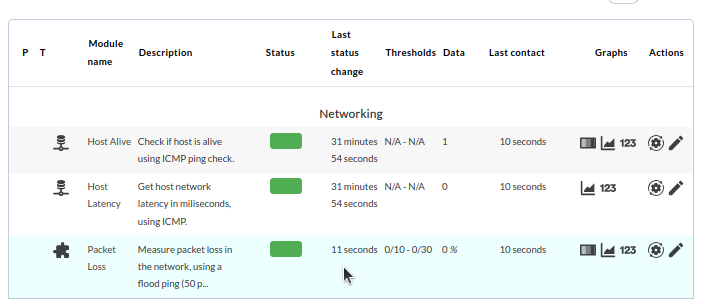
Depending on the plugin, different specific fields will need to be filled in. For example, for the MySQL plugin, you must define the MySQL server IP address, the username and password, and the data you wish to extract:

Agent Plugins
GNU/Linux®
These types of plugins are stored and executed from an EndPoint and can return more than one value.
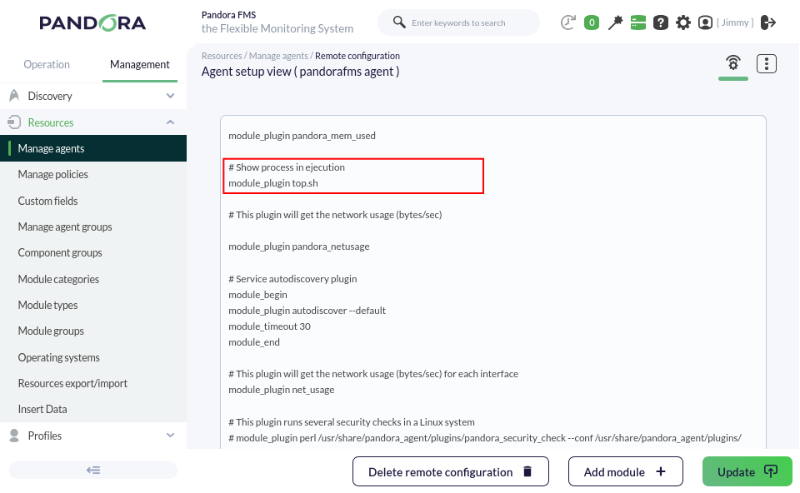
These plugins are stored in the local agent's /usr/share/pandora_agent/plugins/ directory and are defined in the /etc/pandora/pandora_agent.conf configuration file.
Some agent plugins are defined by default in the configuration file. In this example, a plugin called top.sh is used, which shows the processes running on the agent.
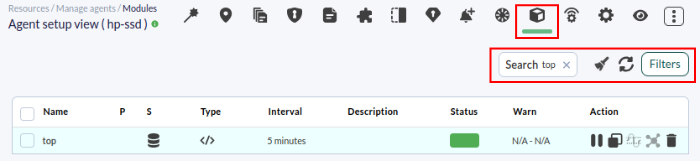
To see the created module and its value (or values, depending on the plugin), go to the Agent view (for the EndPoint) in the Web Console.
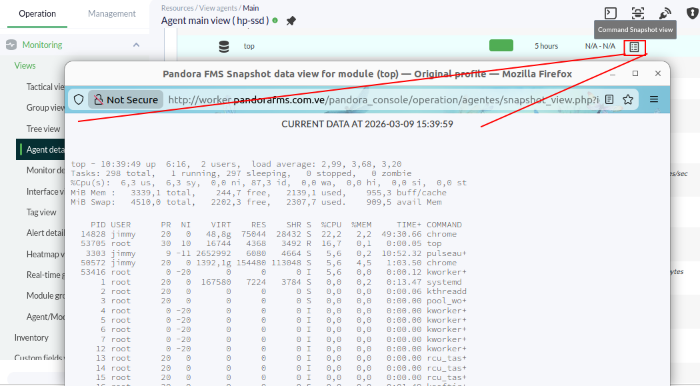
Notice that the obtained data is shown as a paper-sheet-shaped icon. Click on that icon to display the list of processes extracted from the computer via the agent plugin.
MS Windows®
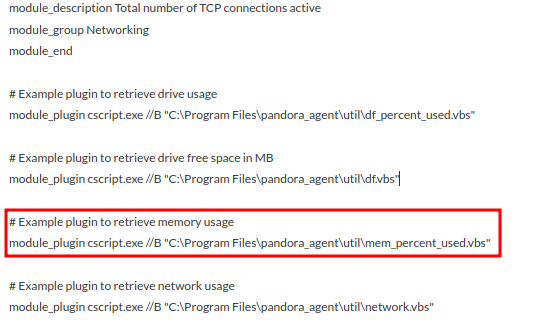
Plugins are stored in the %ProgramFiles%\pandora_agent\util\ directory and are defined in the %ProgramFiles%\pandora_agent\pandora_agent.conf configuration file.
Just as in Linux®, there are some examples of plugins defined in the configuration file.
Are you not achieving the results explained in this chapter? Access the help or support section.
13. Email Alert
In Pandora FMS, alerts are assigned to specific modules of an agent. When said module enters a particular state, actions can be performed, such as notifications to a particular user via the Web Console:
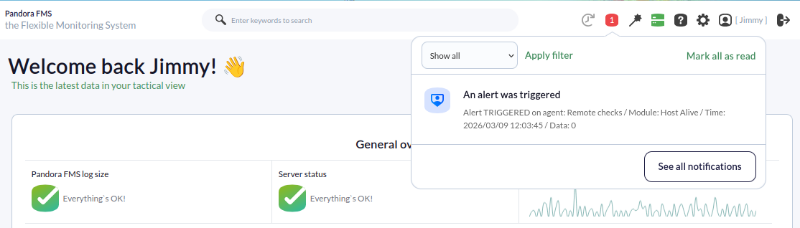
The first alert we are going to create consists of sending an email message when connection is lost on one of the machines being monitored.
Alerts in Pandora FMS are composed of three elements:
- Command (send an email).
- Action (send a message to a specific user, using the previous command).
- Template (execute a specific action when a condition is met).
In this specific case, a predefined command (sending emails) will be used, an existing action (Mail to Admin) will be modified to send it via a specific mailbox, and an existing template will be used, the Critical condition template, which will trigger the alert when the module in question appears in a critical state.
With alerts we can do many more things, such as creating an escalation, creating our own commands (to perform more complex integrations or notifications), sending recovery notices, and assigning alerts in bulk, but we will leave all that for another time. This is a quick guide, right?
Configuring the email alert
Pandora FMS already contains an email delivery server in its installation by default whose sender is yourmail@domain.es. Generally, those emails are classified as SPAM by any recipient. To change the email address in charge of sending notifications, and the server that processes them, we must access from the console the section Management → Settings → System Settings → General Setup. In one of the configuration tabs you will find the Alerts configuration section:
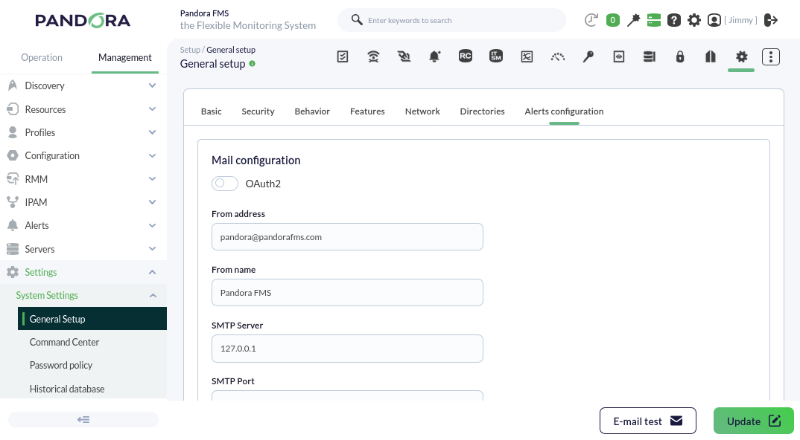
If you use the local server (127.0.0.1) you will not be able to send messages correctly, as it will depend on the configuration of your environment. If you need more information you can consult this link.
To prevent emails from being identified as spam, we recommend that you use a corporate email (Gmail®, Proton®, etc.).
To configure the recipient of an alert, you only need to modify the action. The action is Mail to Admin in Management→ Actions:
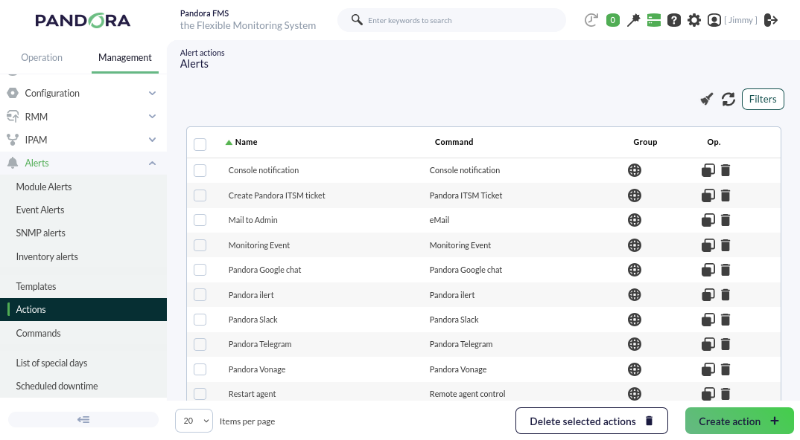
Edit the Mail to Admin action (by clicking on its name) and use this example as a reference:
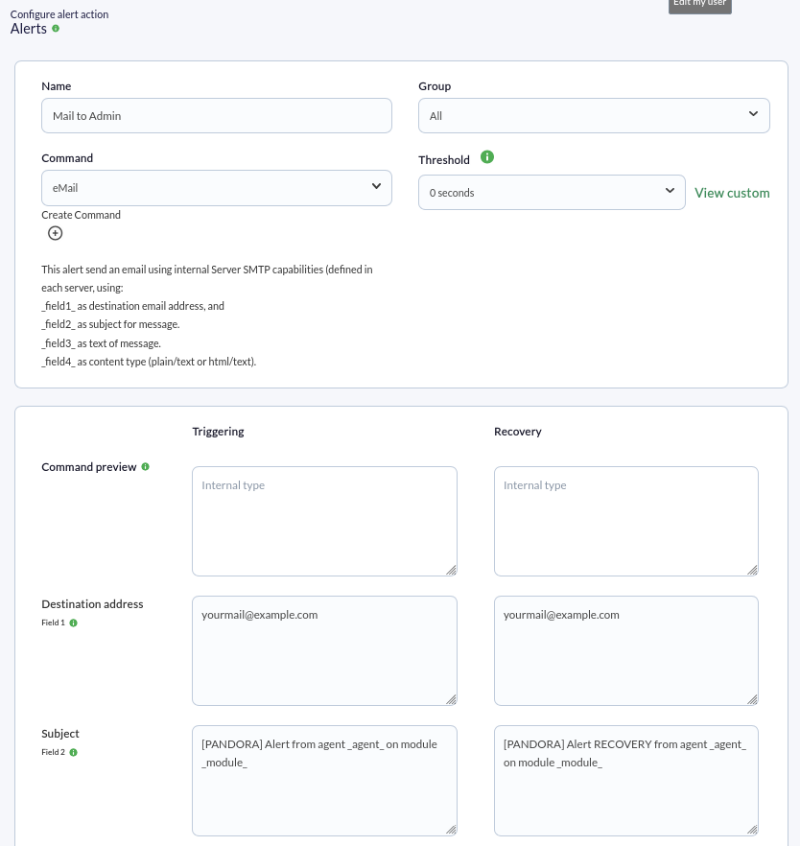
Field 1 (Destination address) will be modified and the destination mailbox address will be placed.
In field 2, leave the text that is in the capture. Here two macros ( _agent_ and _module_ ) are being used which will replace the name of the agent and the module that generated the alert at runtime.
There are about forty macros that you can use to obtain values when executing alerts. See the documentation.
Field 3 can be used to give body to the email, in HTML or plain text:
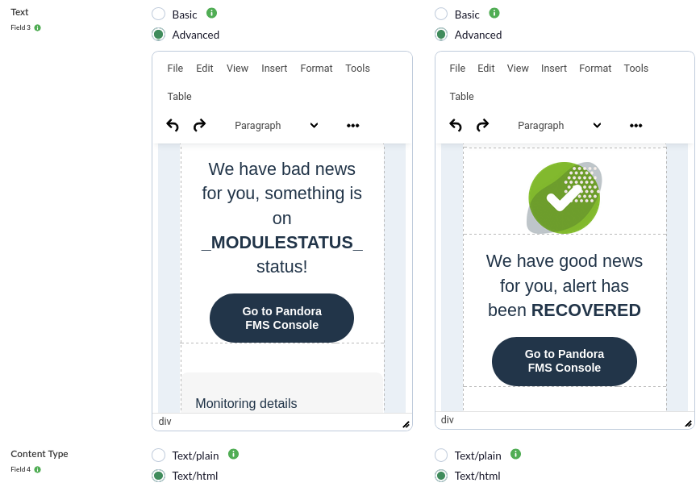
Although Pandora includes an HTML viewer, we recommend that if you are going to compose emails in HTML, copy and paste the code here
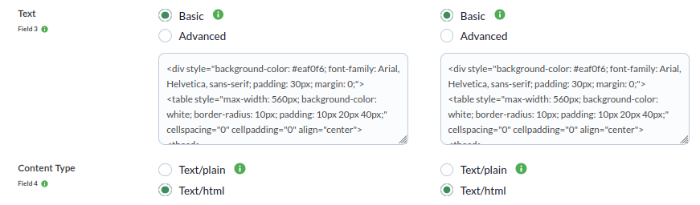
If you have not modified the default action, the HTML template of the email will be similar to this. You can modify it later, now let's see how alerts are assigned.
Assigning the alert to a module

Now we add the module (for example, Host Alive), the template (Critical Condition) and the action that we configured in the previous step ( Mail to XXX ). Add the alert:
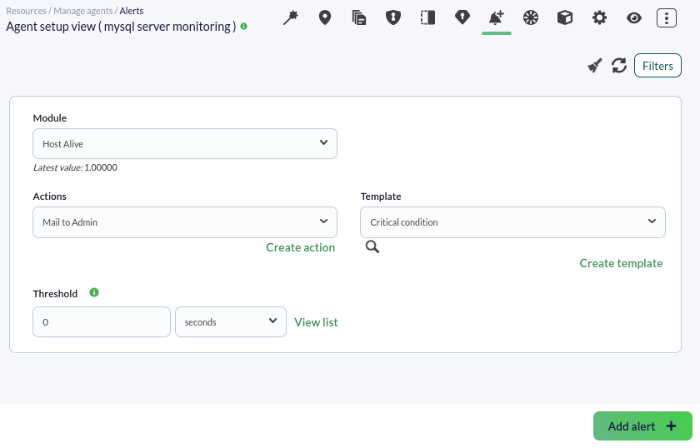
Once added, we can observe it in the agent view checking if it is running or not, by looking at the color of its status:

We can wait (or force) the host to go down to see if the alert works; one way is to insert a zero value directly into the module, which is of true/false type:
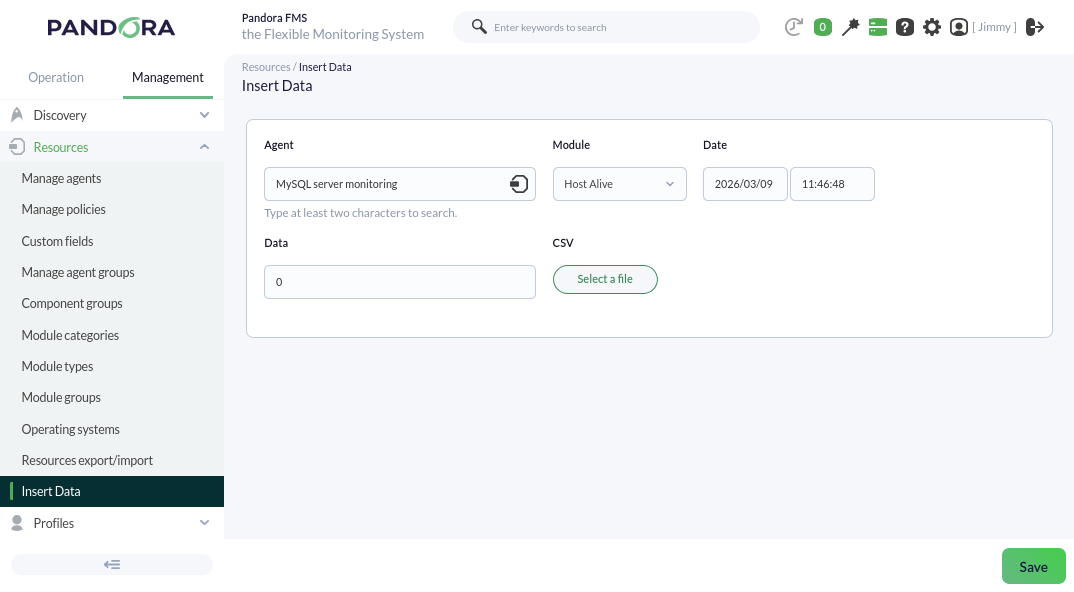
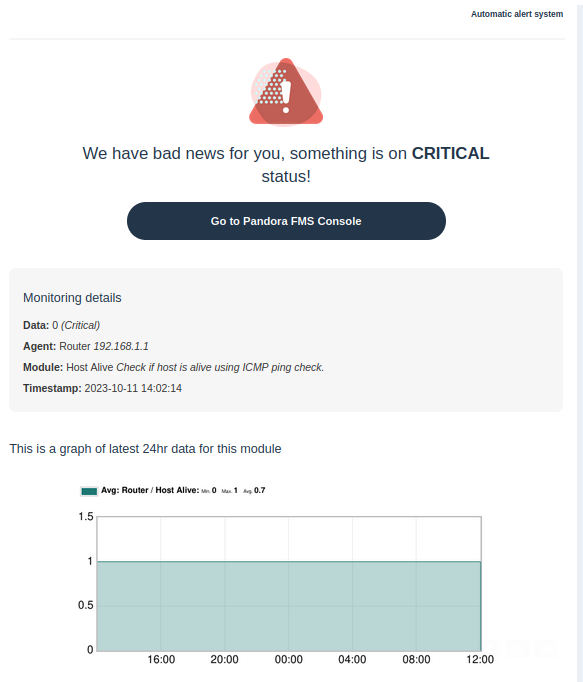
An email with the alert should arrive at the mailbox:
Are you not achieving the results explained in this chapter? Access the help or support section.
14. Create a Custom Report
Pandora FMS offers us the possibility of visualizing monitored data in a personalized way through reports that can be scheduled for email delivery in various formats, exported to PDF, or viewed in real time.
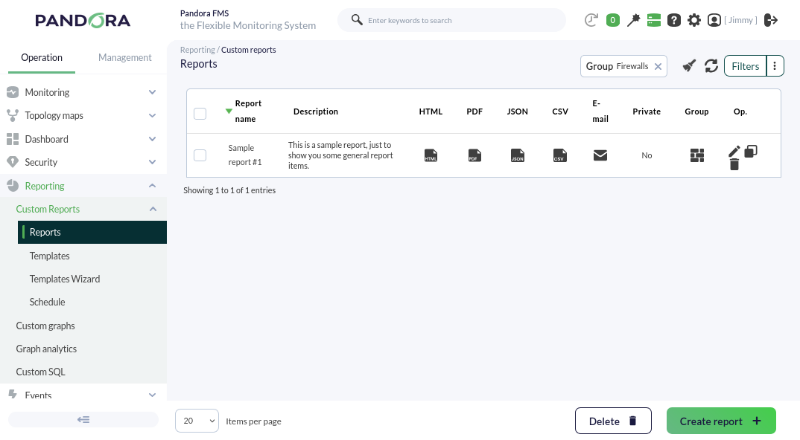
To create a custom report, we will access the menu Operation → Reporting → Custom reports → Reports, where the Create report + button will be available to allow us to create our first report.
The first step will be to define a name, group, write access, and the option to make it an interactive report or not.
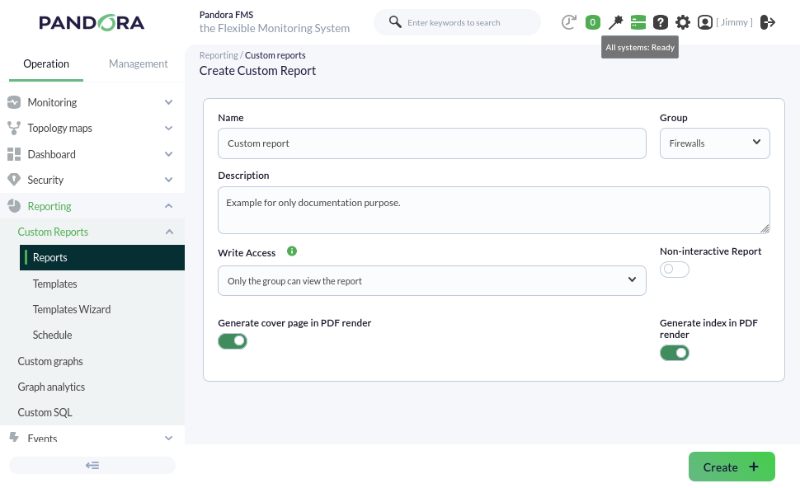
Non-interactive reports are reports that, due to their large size, are better off being scheduled only, as they take time to generate and will therefore have limited visualization via the Web Console.
Once we have filled in this data according to the desired requirements, we see that the top right menu offers new possibilities, allowing us to start adding different items from the monitoring we are conducting.
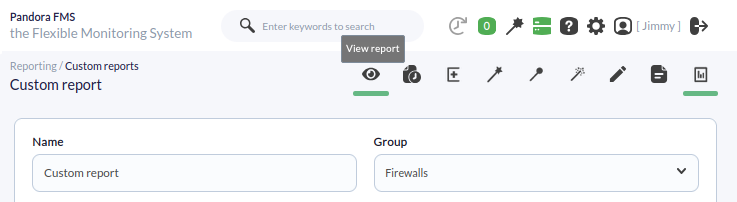
The first option is View report to visualize the report, followed by:
- Report task: Even if the report is interactive, it can always be scheduled, periodically or not, for email delivery or local storage (or on a shared network drive). Schedules created with this option can be modified (or deleted) in the menu Operation → Reporting → Custom reports → Scheduled.
- Advanced options: Where you can modify the cover page, page orientation, etc. (PDF format).
- Global: A wizard with two powerful and fast options to create Top N reports (General or Exceptions); the search for agents and modules offers filtering by regex and other useful options.
- SLA-Wizard: A dedicated wizard for Service Level Agreement (SLA) compliance reports.
- Wizard: To quickly generate the most commonly used report types (alerts, events, grouped, etc.).
- Item editor: Where you can add more and more report types (remember, you can always mark as Non-interactive if the report becomes too large).
- List items: To edit or delete elements added in the previous option.
- Main data: To edit the same fields specified during the report creation.
Below is a brief description of some of the options mentioned above.
Wizard
General wizard that allows us, for example, to add graphs from different agents/modules to the report:

This wizard allows you to easily create other types of elements within the report, such as displaying maximum, minimum, or average values of modules over a time interval, a list of triggered alerts, or generated events.
SLA Wizard
This wizard allows us to create SLA report items automatically. You can choose the validity ranges for the values of the modules to be selected. This feature allows you to check the % of time a module has maintained values within specific ranges. If thresholds are not defined, they will dynamically adjust to the criticality thresholds of each module. In short, you will be able to know what % of the time they behaved as expected.
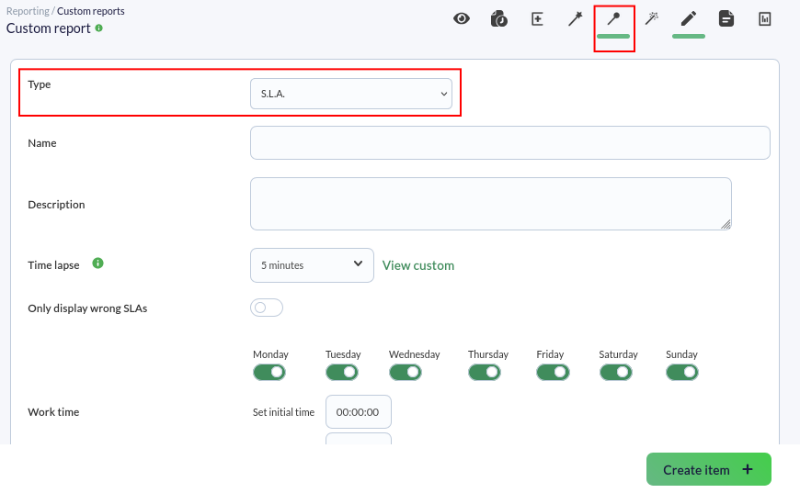
Global
Grouped reports are also available:
- Global: In this section of the report, we can create Exception, General, or Top N elements simply by using a wizard.
- Exception: This shows values from several modules that satisfy a logical operation (e.g., show the % occupancy of those links that have an activity higher than 100 KB/Sec).
- General: Shows values from several modules sorted (ascending, descending, by agent name) and/or grouped by name.
- Top N: Shows N values discriminated by maximum, minimum, or average over the total modules added, sorted ascending, descending, or by agent name.
In this way, we can add different modules from different agents, while also choosing the operation to be performed for each module: sum, average, minimum, maximum.
Item editor
In this tab, we can find more specific elements, such as the possibility of creating inventory elements for our reports.
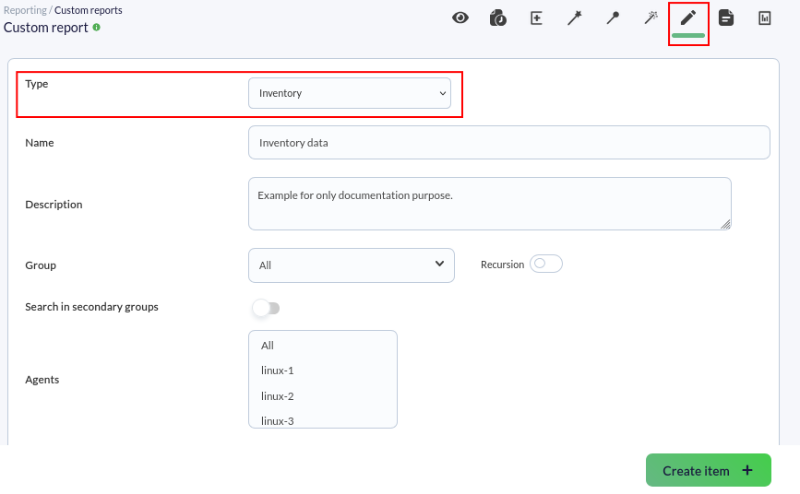
This will allow us to display hardware and software data for the agents we select, provided they have inventory value collection enabled.
Once the reports are configured, we can view them using the View report icon. In the case of our report, these are the results:
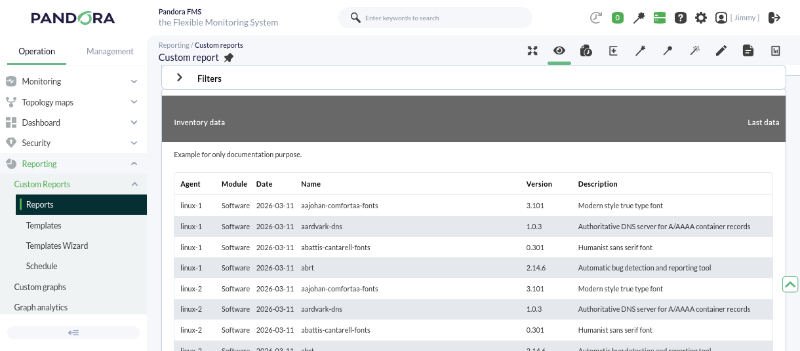
Are you not achieving the results explained in this chapter? Access the help or support section.
15. Visual Console Creation
Creating a Parent Visual Console
In this first map, we are going to add the status of several agents distributed across a world map. This can be done manually, one by one, or through the Wizard. To facilitate its creation, we are going to use the Wizard in this example.
The first thing we need to do is create a new map, which we will call World Map.


Once created, we click on the Element Wizard:
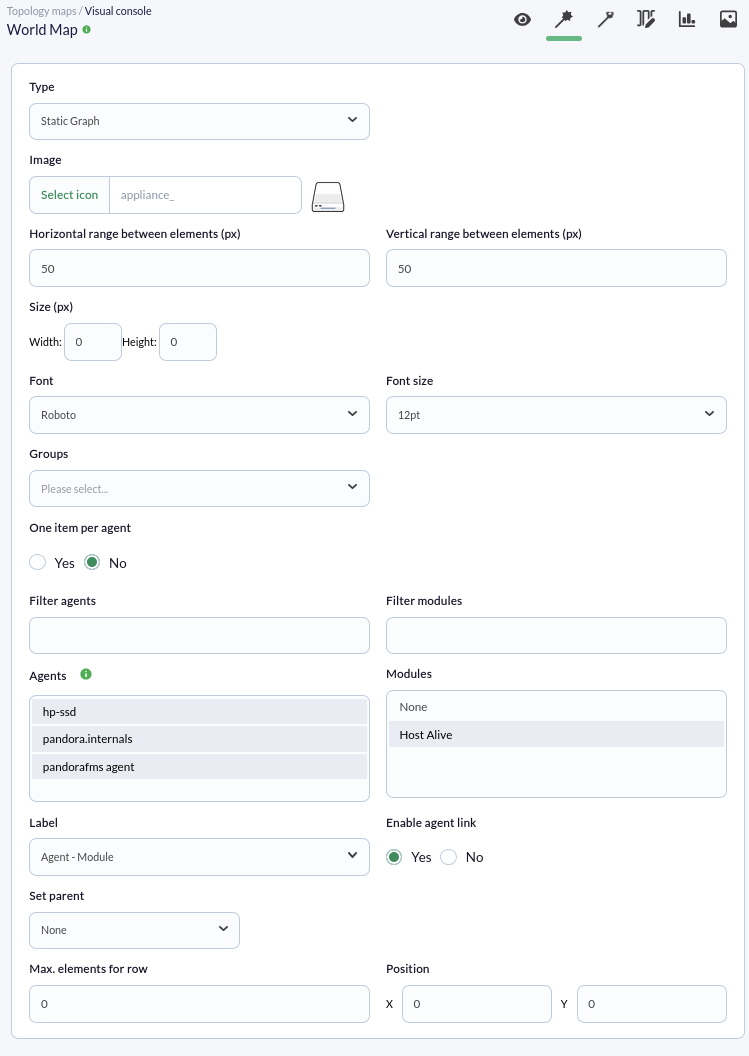
In the Wizard, we select the element type—in this example, Static Graph (previous screenshot)—the image we want to use, whether we want to use one item per agent or per module, and we select the agents along with the modules to be added from the list that appears.
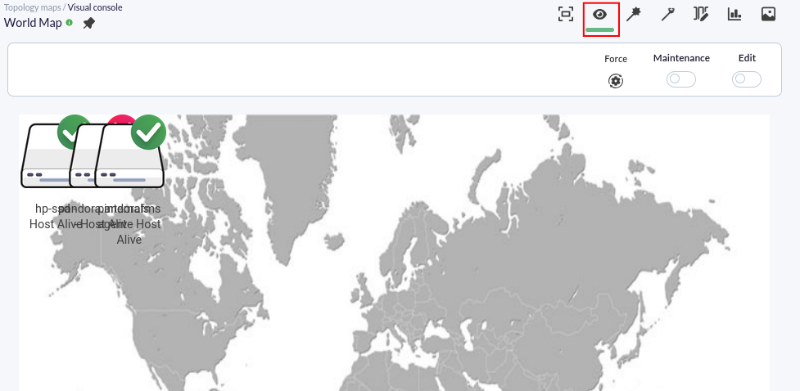
We click the add button, go to the "View" tab, and all the created elements will appear on the map, as shown in the following screenshot:
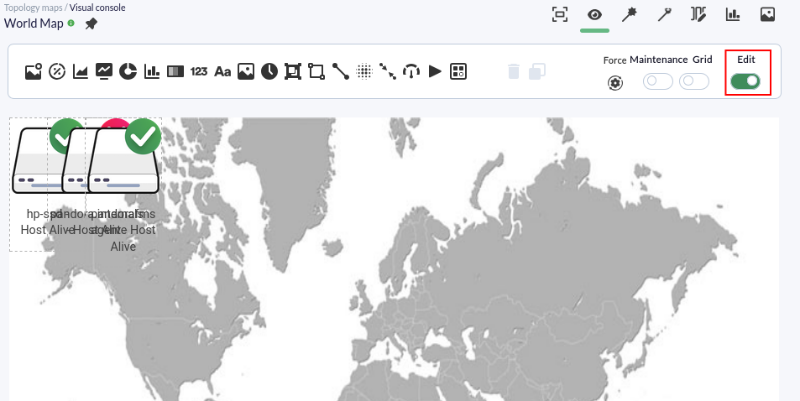
To be able to move or add elements, we must enable the Edit token.
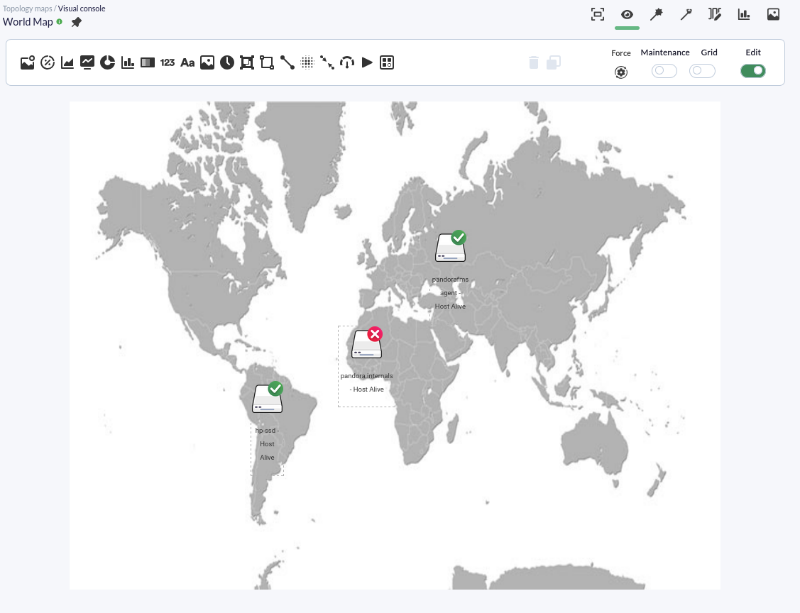
We move all elements to where we want them positioned on the map by clicking and dragging them across it.
Creating a Child Visual Console
In the second map, an element will be created to indicate the status of one of the main agents, with all its modules linked to it.
The first step is to create the new map just as we did last time:
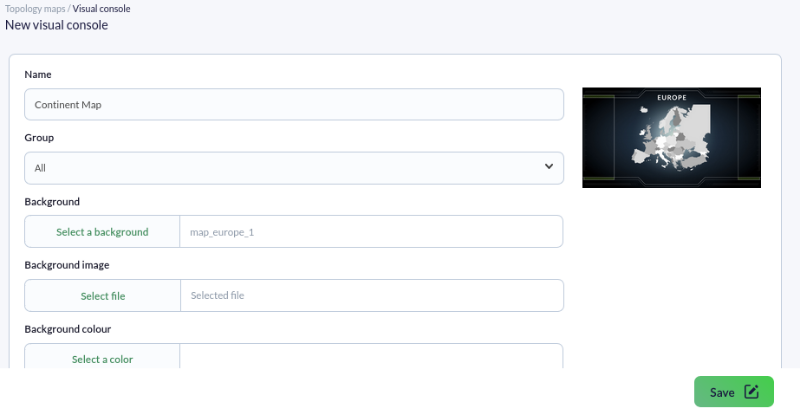
Once created, we add the element that shows the agent status by selecting the Static image element type:
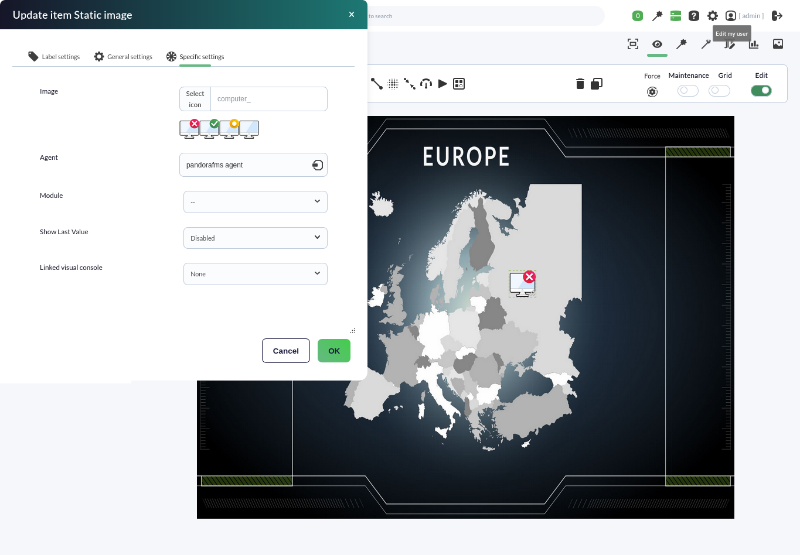
We also create a chart by choosing the Basic chart element, adding the agent and module whose graph we want reflected.
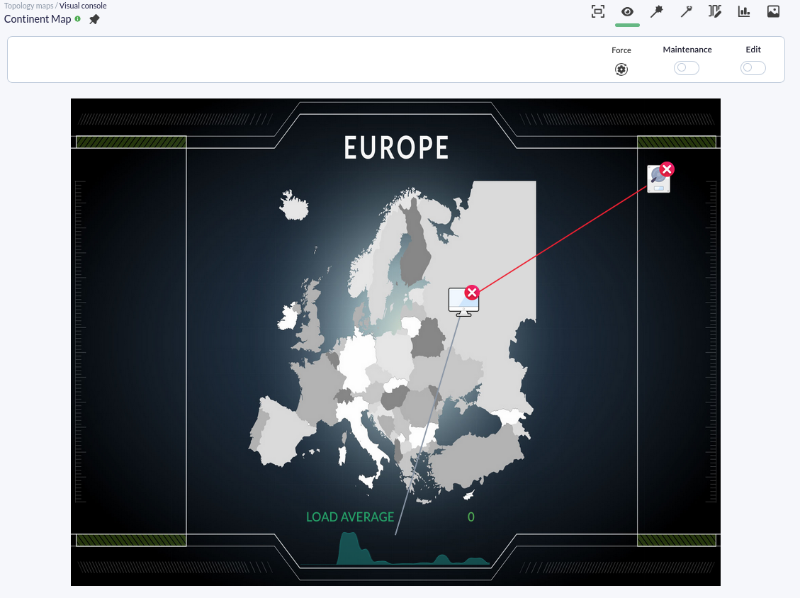
We have now created the main element of the map; now we are going to create a new element for each of the modules existing in the agent. To do this, we will use the Wizard for configuration. We select the agent's Static Graph and the indicated modules. We label it with the module name and assign it a previously created parent on the Visual Map—in this case, the previous element we added.
After creating all these elements, they will appear linked to the main element, and we can move them by dragging them directly with the mouse to the desired position.
Linking Between Maps
In the previous steps, we created the two maps. In this step, we will show how clicking on the element located over Spain on the "World Map" directly opens the "Continent Map".
To do this, we open the World Map in edit mode by double-clicking on the element to open its editor. We click on advanced options and, in the Linked visual console option, we select Continent Map. We update the element by clicking the OK button.
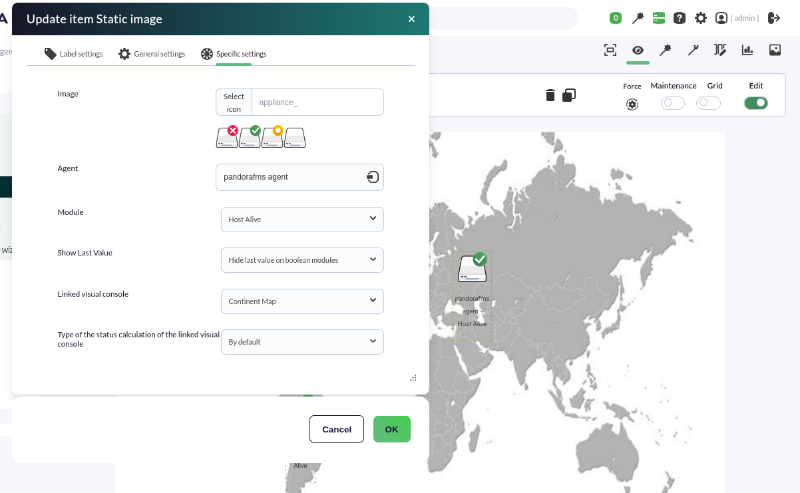
Returning to the World Map view, we click on the element located over "pandora fms agent" and the Continent map will open directly. Even if only one element in the map were red, the icon representing the Continent map on the parent map would also appear in red.
Are you not achieving the results explained in this chapter? Access the help or support section.
16. Dashboard creation
A Dashboard is a Pandora FMS feature that allows each user to build their own monitoring page. More than one page can be added, and on it, you can include monitoring maps, graphs and status summaries, brief event lists (with filters), and many other widgets.
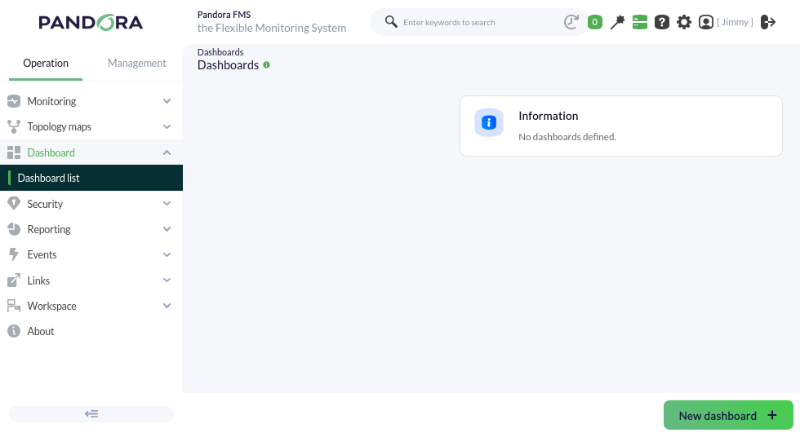
To create our own dashboards, it will be necessary to access Operation -> Reporting -> Dashboards, where we can select the New dashboard button to create the ones we need.
Pandora FMS will show us a new window in which we can name our new Dashboard and define if it will be a private Dashboard, the monitoring group it belongs to, or if we want to set it as a favorite, thus allowing it to appear in the side drop-down menu in the dashboards section.
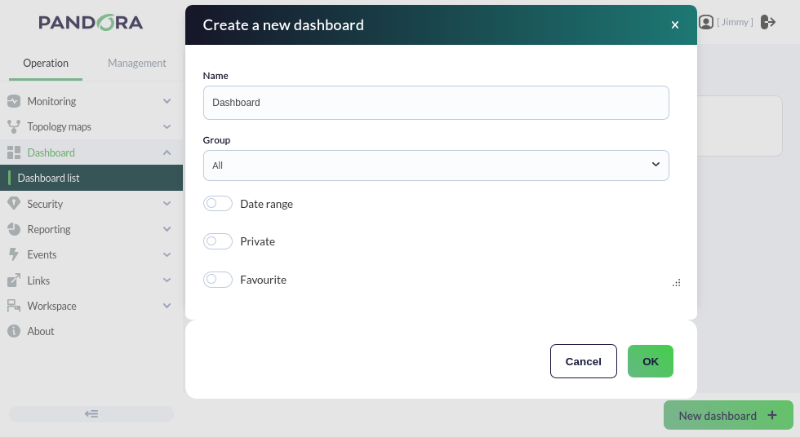
Once these steps are defined, we can directly configure our first widget.
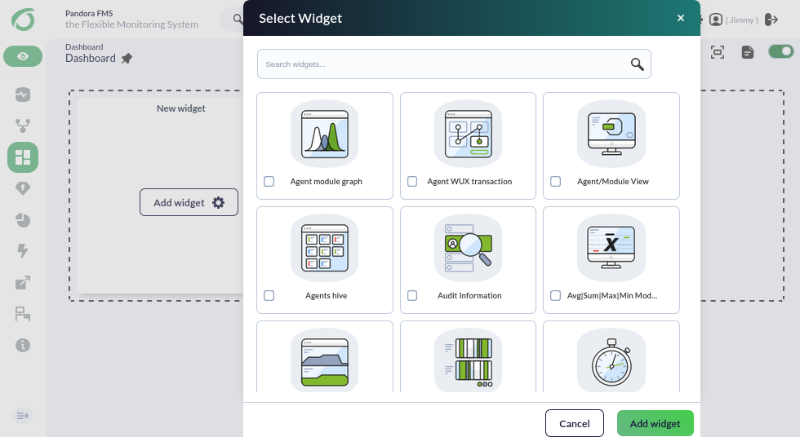
We will be allowed to choose between different monitoring aspects of our environment to display them on screen. We can choose, for example, the list of the latest generated events.
This will prepare our widget, which we will have to configure to define the desired parameters, such as the type of events we want to show, the size of the list, the severity, or the group they belong to.
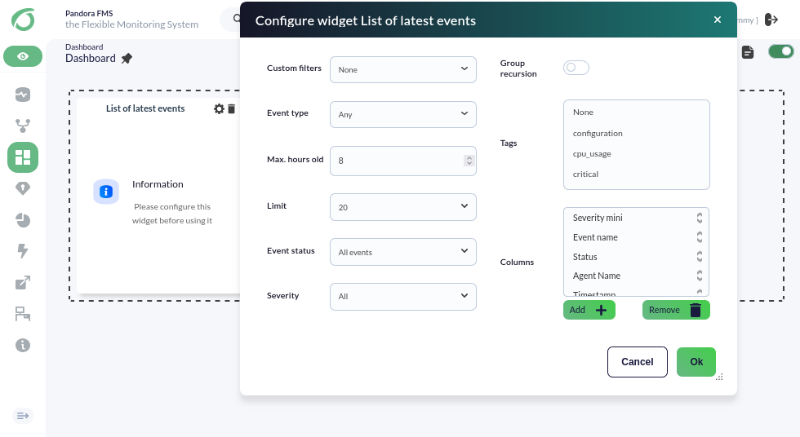
Once selected, our widget will start showing the data and we can begin adding as many as we want by pressing the “Add cell (+)” button in the edit view.
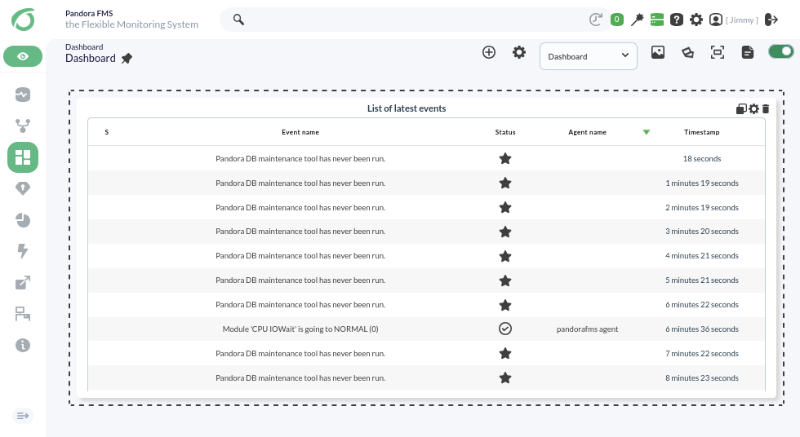
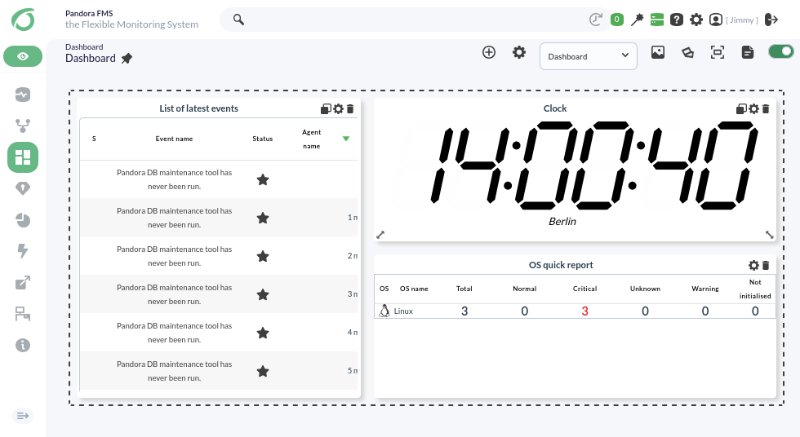
Following this process, you can build a dashboard like this in a matter of a few clicks:
Are you not achieving the results explained in this chapter? Access the help or support section.
17. Inventory
Pandora FMS allows you to maintain an inventory of the devices monitored by Pandora FMS. It is possible to keep a list of the processor model, storage, running services, software installed on the computer, among other types of information.
The inventory is independent of the monitoring and can be obtained:
• Remotely, through inventory Modules.
• Locally, with the Pandora FMS EndPoint, through Agent plugins.
We can create our own Remote and Local inventory modules, but this quick guide does not go into detail on that.
Remote inventory
To assign this type of inventory to a remote agent, access the agent's edition and go to the Inventory tab.

Fill in the fields with the following information:
- The type of inventory we want to obtain, in this example the CPU model.
- The Target IP, which in this case is 192.168.9.212.
- The username and password of an existing user on the remote computer.
Optionally we can set a custom interval for the module execution and make use of Custom fields. Click on the Add button.
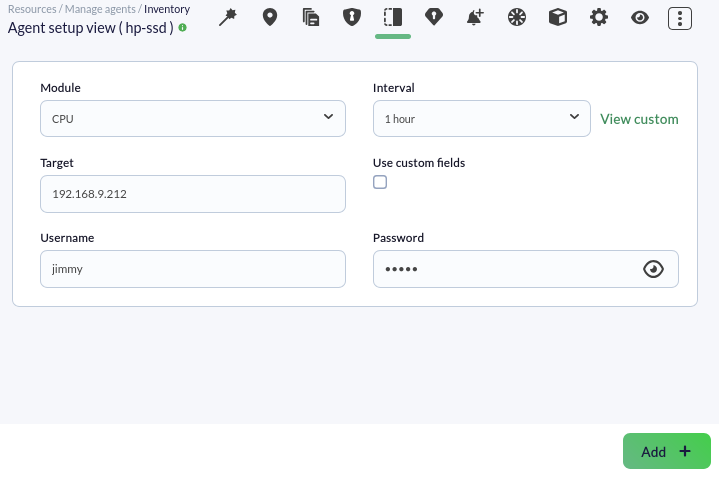
The inventory module will have been applied and we will be able to perform actions such as deleting, editing, and forcing the execution of the module by clicking on their respective icons.

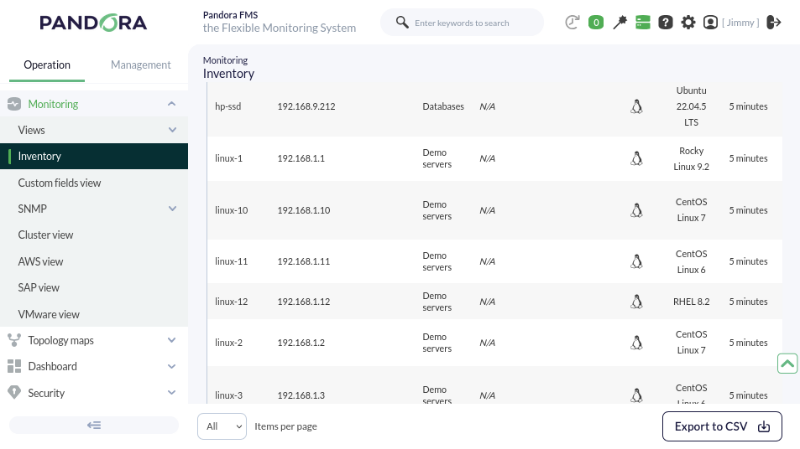
We can see the data collected by the remote inventory module from Operation → Monitoring → Inventory.
Local inventory
These inventory data are obtained through an EndPoint; the configuration is a bit different depending on whether it is an EndPoint for MS Windows® or Linux®.
MS Windows®
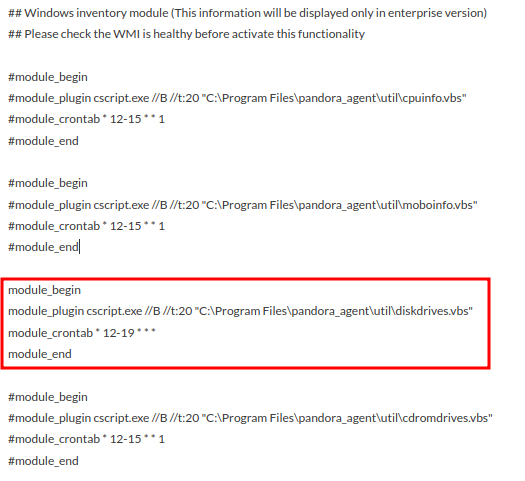
By default, there are inventory templates in the EndPoint configuration file pandora_agent.conf; to enable local inventory modules we uncomment the corresponding code block, in this case inventory from the available storage disks will be collected:
We define the execution interval via cron.
Linux®
In Linux® inventory modules are also defined in the pandora_agent.conf file, but unlike MS Windows®, here it is established by uncommenting a single line, specifying the inventory we wish to obtain.
The line means that an inventory plugin will be used, the 1 means that inventory data will be collected every 1 day (we set it to 0 if we want it to be collected at each agent execution), and the objects from which we want to collect inventory data:

Are you not achieving the results explained in this chapter? Access the help or support section.
18. Events
An Event is everything that happens within the system; from the creation of a module to a user login in the Console. The event itself is a descriptive text of the problem, its origin, an agent, and its creation date.
Pandora FMS allows the real-time visualization of all happenings in our monitored systems; with this information we can perform the necessary actions according to the event created.
Information is shown ranging from any module status change, triggered or recovered alerts, to system restarts or custom events.
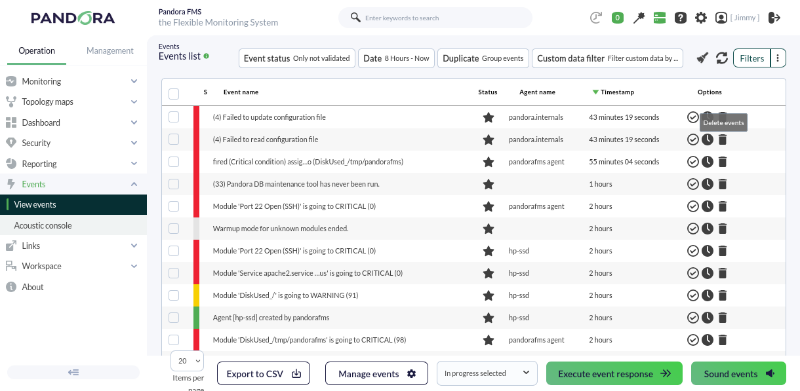
Depending on the information carried by the event, it will appear in one color or another. For example, if an information event arrives stating that a module has entered a critical state, this event will appear in red.
Thanks to this default view, we can observe active "problems" in real time.
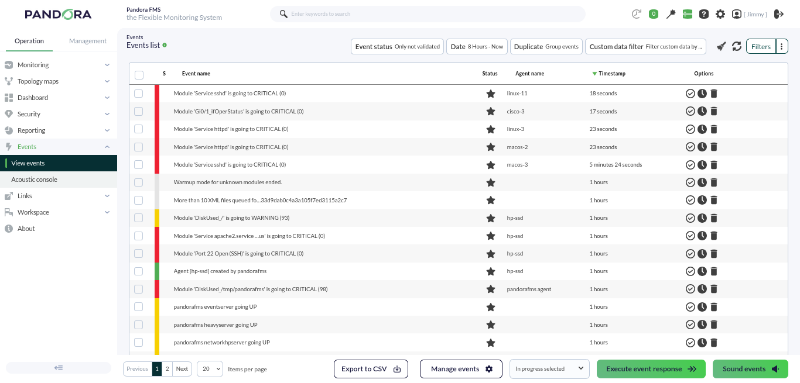
Events for transitioning to an incorrect state, critical or warning, are automatically validated upon recovering normality. This is what we call event auto-validation in Pandora and it is an essential functionality, as it allows hiding information that is no longer relevant in the event console.
There is the possibility in Pandora FMS to set alerts on events, so that instead of acting on each module, it can be done on a certain group of modules, generalizing monitoring and making alert deployment much easier.
Furthermore, correlation rules can be created on events, developing authentic logical heuristics when dealing with events. Obviously, these are advanced and complex features that are not covered in this quick guide.
Are you not achieving the results explained in this chapter? Access the help or support section.
19. Working with Policies in Pandora FMS
Pandora FMS offers us the possibility to work with the module and alert creation and management tools seen previously in more efficient ways. One of these is the mass operations tool.
However, the most powerful of these tools are monitoring policies (or simply policies).
Policies are groups of configurations where we add elements that can later be loaded in bulk onto agents or groups of agents. These elements can be monitoring modules (remote or local), alerts, inventory, and script collections for local monitoring.
Monitoring policies are an advanced feature of PFMS.
Policies are designed to facilitate the initial deployment of all monitoring and also to standardize monitoring management, as we can unify checks using different criteria such as Operating System, applications, network..., that is, by any common factor of the EndPoints and remotes installed or included previously.
We will see some already created by default and others that we have created specifically for monitoring implemented by us specifically according to the applications to be used.
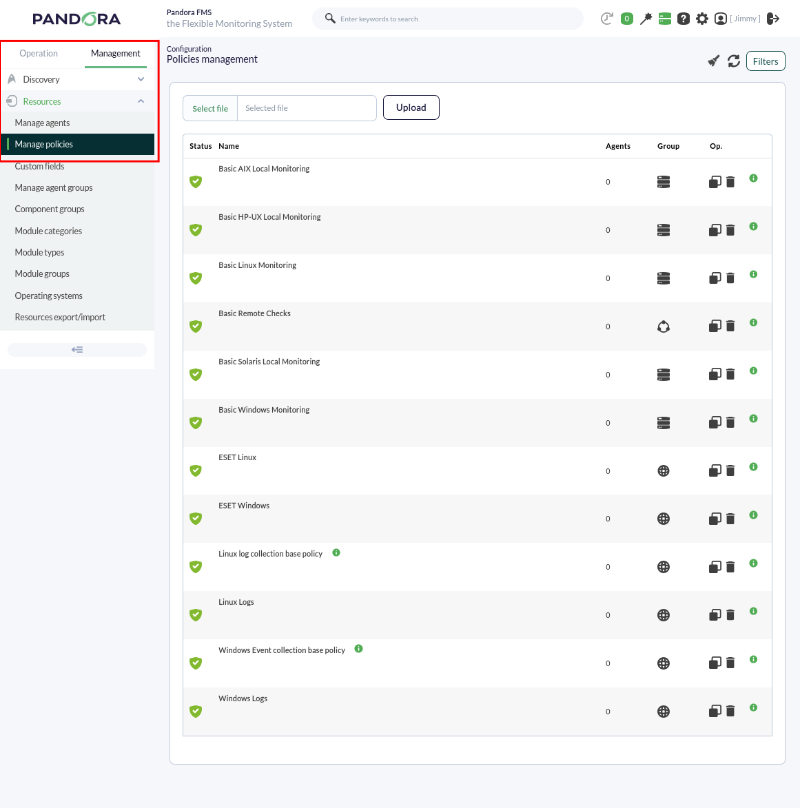
If we look at the policies located at the top, we find those intended for operating systems such as MS Windows®, GNU/Linux®, or Solaris®.
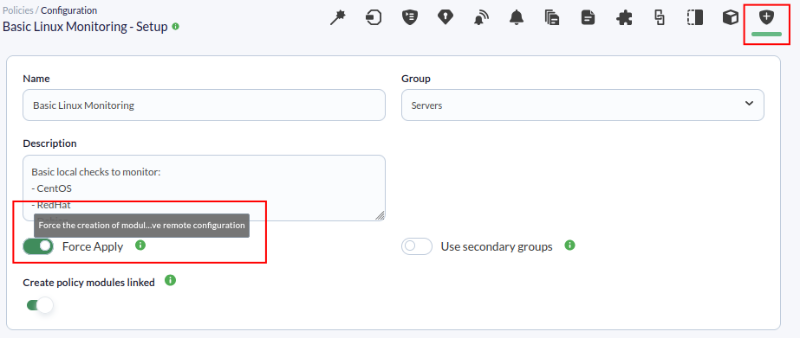
It is important to mention that local type modules will be applied if the EndPoint has remote configuration enabled; in any case, we can force the creation of local modules from the policy configuration by enabling the Force Apply token:
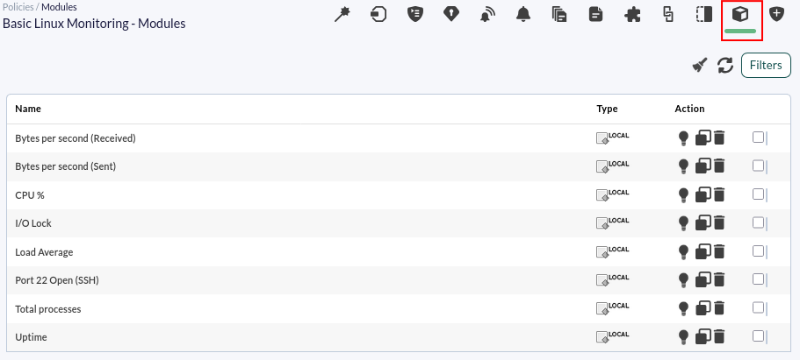
Policy modules
For example, with the basic Linux® policy, if we move to the modules part, we see some already preloaded to obtain checks corresponding to CPU usage, available memory, and other metrics. These modules can be both local and remote:
Right next to it we have another menu with options such as a Wizard to create both interface and WMI modules. We can create inventory modules, link policies and modules, use agent plugins to monitor applications, use collections to upload files between the PFMS Server and the EndPoint, or create both internal and external alerts.
External alerts
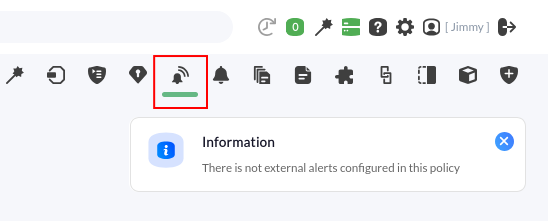
In policies, we can establish external alerts, which are alerts for modules defined in the agents to which the policy has been assigned—that is, modules belonging to the agents and not to the policy itself. To do this, we go to the External Alerts tab and click on Add.
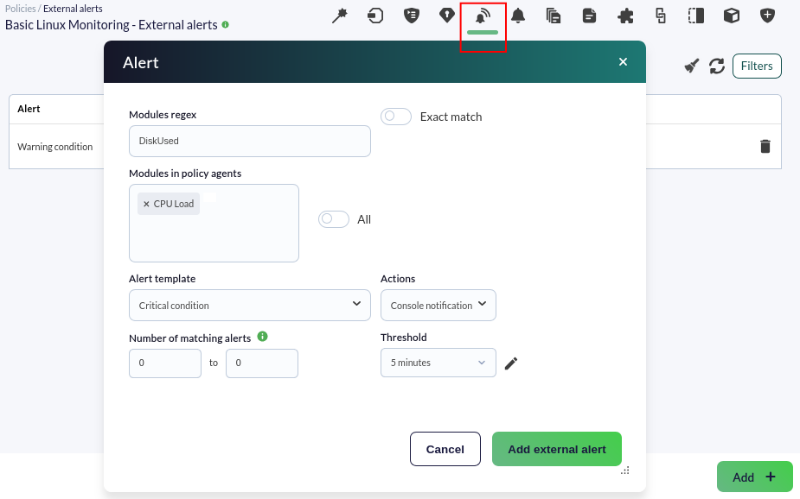
The following window will be displayed, where we must choose the modules to be added to the alert, under what condition it will trigger (in this case, when the module status is critical), and the action to be launched.
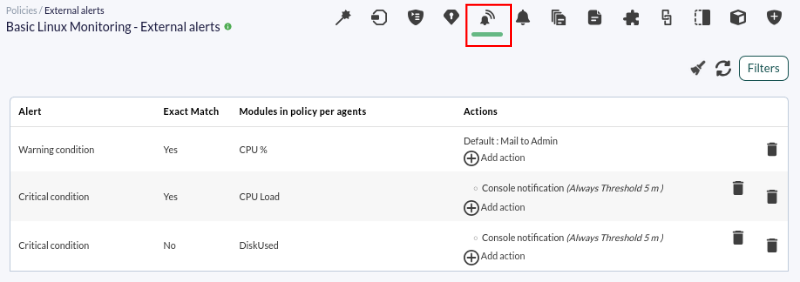
Click on Add external alert and observe the created alerts:
Alerts
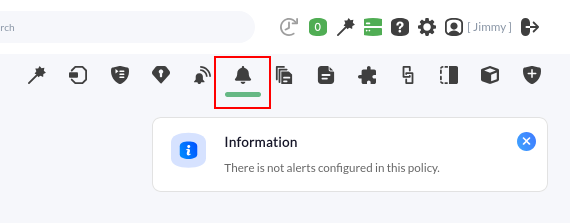
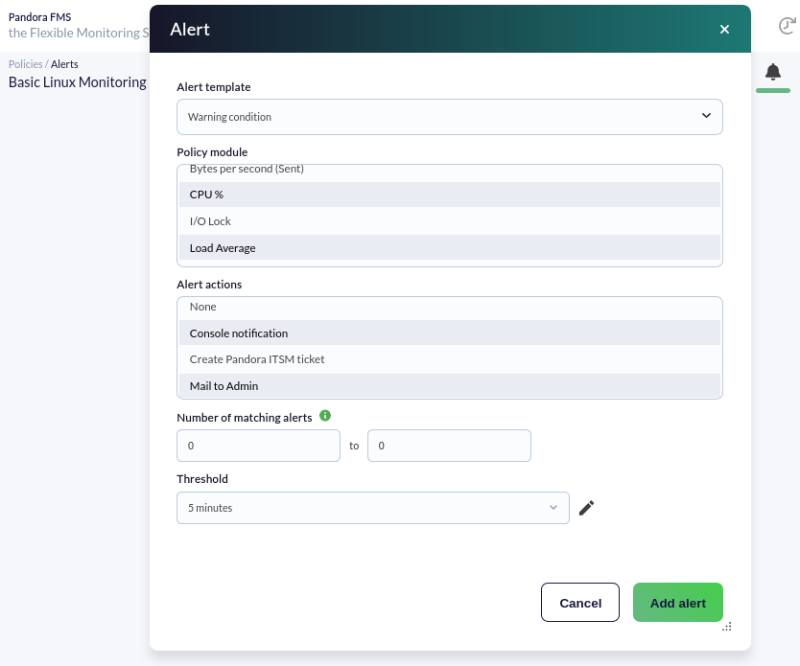
This type of alert is established only for modules defined in the policy; we go to the Alerts tab and click on Add.
A window similar to the previous one will be displayed where we select the modules assigned to the alert, the condition under which the alert will trigger, and the action to perform when the alert is launched.
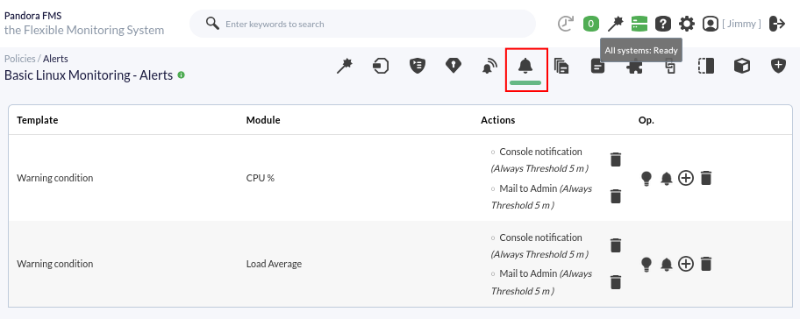
Click on Add alert and observe the created alerts.
Collections
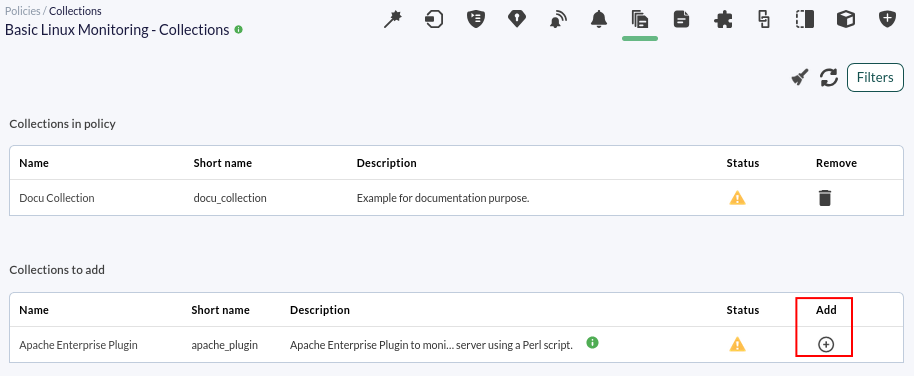
Collections are sets of files that we can deploy in bulk to our EndPoints using policies; to do this, we go to the "Collections" tab.
We observe the collections that are applied to the policy; to add another collection, click on the Add(+) button.
Agent plugins
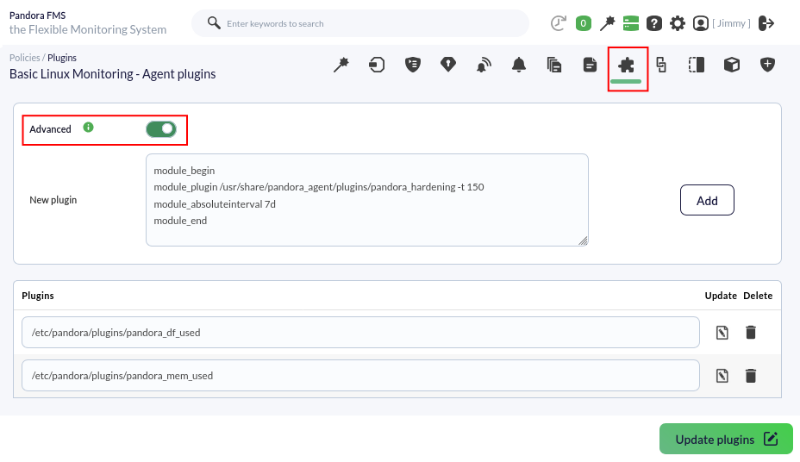
We can also deploy agent plugins in bulk through policies; we observe existing ones and add new ones from the Agent plugins tab.
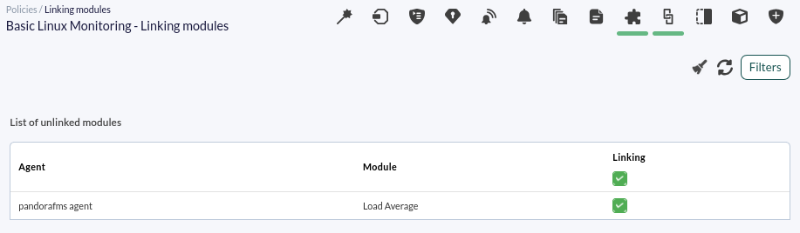
Linking
Here appear the policy modules that are not linked to the agent, so changes made to those modules will not take effect on the agents unless we link them again by checking the modules and clicking on the Link button.
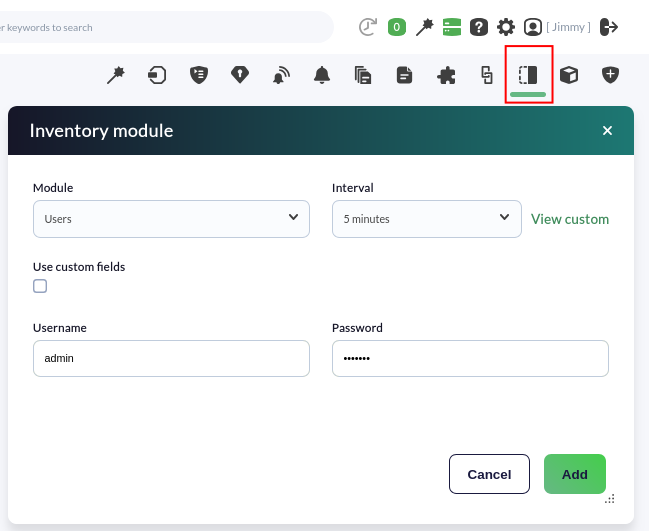
Inventory modules
We can also add inventory modules in bulk with policies from the Inventory modules tab, although inventory collection is performed remotely, so all agents to which we assign the policy must have the same access credentials.
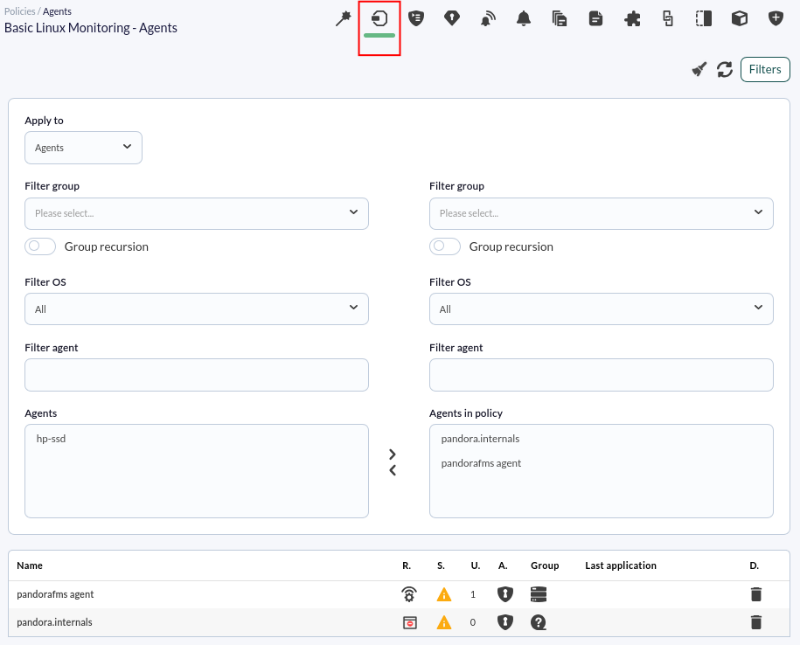
Assign agents to the policy
Once a policy is defined, we will assign it to new agents:
And we will apply the policy to the agents assigned to that policy. In this way, we "synchronize" the configuration of all agents and ensure that their monitoring configuration is the same for all agents in said policy.
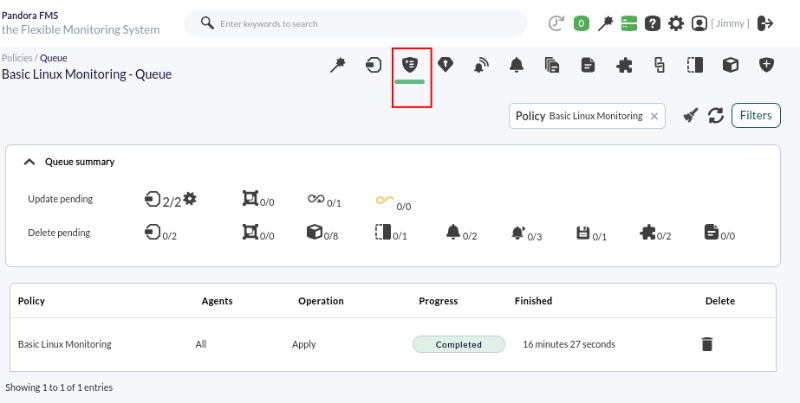
Once this last operation is carried out, all selected agents will have in their configuration the modules that this policy brings, alerts, plugins, collections, and inventory in a mass, simple, and fast way.
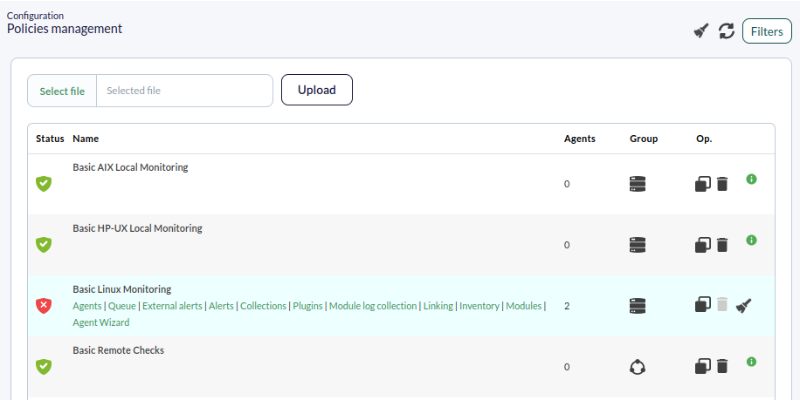
If when viewing all existing policies that icon appears, it means that the policy has had changes and is pending application on all involved agents.
Delete policy
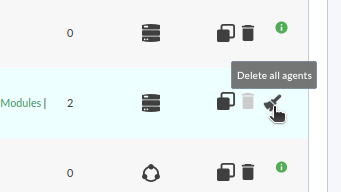
To delete a policy, we must remove all applied agents from it; we can do this by clicking on the broom icon, then the trash can button will be enabled to delete the policy.
Are you not achieving the results explained in the chapter? Access the help or support section.
20. Next Steps
This guide does not cover them but you may be interested:
- Network Maps.
- Monitoring with SNMP Traps.
- Log Collection and Monitoring
- WEB User Experience (WUX) Monitoring.
- Managed system remote access (Quick Shell)
21. Where to Look if Problems Arise?
In the face of any problem, Pandora FMS offers different tools to take action:
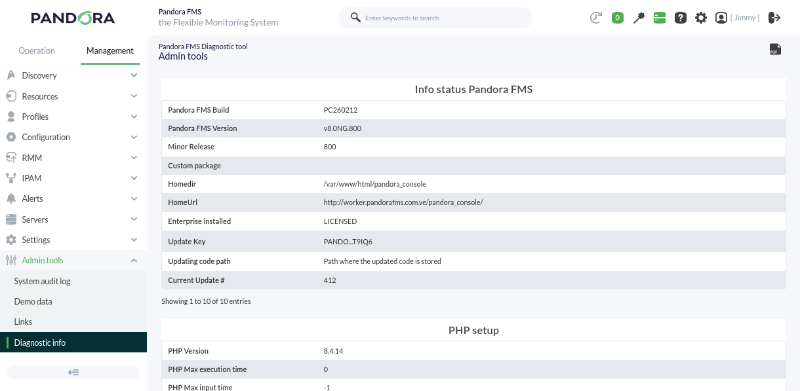
- Diagnostic tool: in Management → Admin tools → Diagnostic info, it will provide a list of essential system information.
- Event viewer. In Operation → Events → View events. It will allow us to visualize all events generated in our environment and operate with them simply.
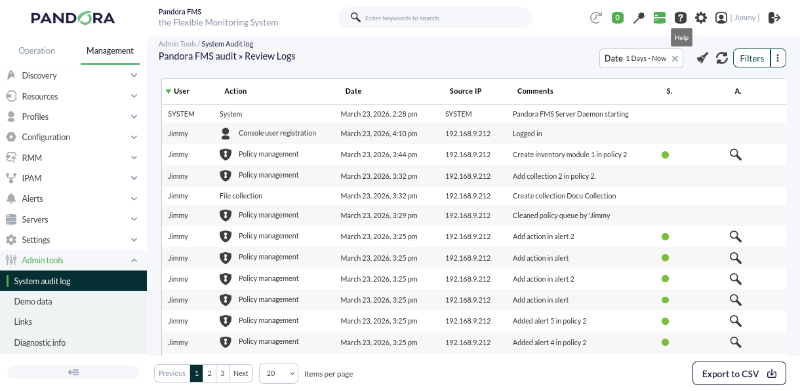
- Audit viewer. In Management → Admin Tools → System audit log. It will show us detailed information about the monitoring environment.
Advanced information sources
Information sources (logs) where we can look for more information, errors, etc.:
/var/log/pandora/pandora_server.logServer log file, contains very important clues. If you want more detail, modify the "verbosity" parameter in the server configuration file to show more detail./var/log/pandora/pandora_server.errorServer uncaptured error log file, contains traces of errors not handled by the server, usually relevant issues./var/log/pandora/pandora_agent.logUnix agent log file.%PROGRAM_FILES%\pandora_agent\pandora_agent.logMS Windows agent log file./var/www/html/pandora_console/log/console.logPandora FMS Web Console log file./var/log/httpd/error_logApache server error log file (httpd)./var/log/messagesSystem log file.
22. Support
Pandora FMS Forum
The forum is open 24 hours a day, 7 days a week to everyone; you can create an account and ask questions. It is completely free, and there are communities in English and Spanish. It has more than 15,000 messages that can help you find the solution to a problem like yours or allow you to ask our community.
Pandora FMS FAQ
We have a list of frequently asked questions (FAQ) that can give you a hint or directly provide a solution to a specific problem.
Pandora FMS Official Training
Of course, you also have the training option through the official Pandora FMS courses (with certification). More information on our website.