AWS EC2
This document describes the AWS EC2 functionality of PandoraFMS discovery.
- Introduction
- Compatibility matrix
- Prerrequisites
- Parameters and configuration
- Manual execution
- Discovery
- Agents and modules generated by the plugin
Introduction
The purpose of this plugin is to monitor EC2 instances and AWS regions, using key metrics regarding CPU, networks, IOPs and disks that are essential to control and monitor these machines and to guarantee optimal performance, solve problems, plan scaling , comply with SLAs and improve security.
Total and regional costs are also monitored, which is useful for keeping track of these directly from Pandora.
The plugin connects to the AWS API and monitors zones and instances using the aforementioned metrics, generating an agent for each zone and instance via XML that is sent to the Pandora server.
Compatibility matrix
| Systems where it has been tested | Rocky linux, Fedora 34 |
| Systems where it works | Any linux system |
Prerrequisites
- AWS API Connectivity
The plugin is a binary that contains the packaged dependencies so it is not necessary to install any type of dependency for its use. - Permissions
To make requests through the API, the account used to authenticate during execution requires certain permissions.
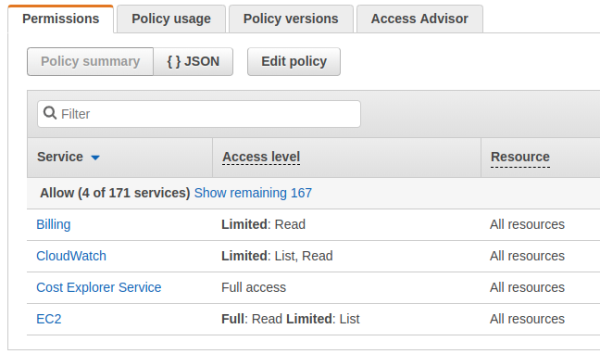
Billing (read)
CloudWatch (list,read)
Cost Explorer Service (Full access)
EC2 (full read, limited: list)
Permission Assignment
Create a policy in JSON like the following:
{
   "Version": "2012-10-17",
   "Statement": [
       {
           "Sid": "VisualEditor0",
           "Effect": "Allow",
           "Action": [
  			   "ec2:DescribeInstances",
               "ec2:DescribeVolumes",
               "aws-portal:ViewBilling",
               "cloudwatch:GetMetricStatistics",
               "ec2:DescribeAddresses",
               "ce:GetCostAndUsage",
               "ce:GetTags"
           ],
           "Resource": "*"
       }
   ]
}
The previous policy must be assigned to a new user.
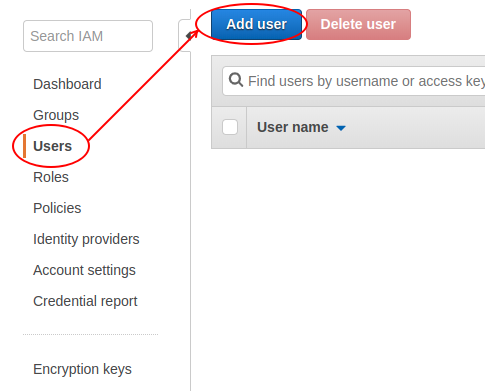
The user who has these permissions will be able to access AWS EC2 monitoring through this plugin.
To obtain advanced statistics for EC2 instances, detailed monitoring must be enabled on the specific instance. This is done from the instance menu in AWS.
Actions -> Monitoring and troubleshooting -> Manage detailed monitoring -> Enable
Parameters and configuration
Parameters
| --conf | Path to configuration file |
Configuration file (--conf)
agents_group_name = < Name of the target group for the created agents >
interval = < Interval in seconds for agents and for metric analysis >
interval_cost = < Time interval for costs, in seconds >
threads = < Number of execution threads, each zone/instance will be equally distributed in the number of threads >
transfer_mode = < Transfer mode, tentacle or local >
tentacle_ip = < IP of the target machine for the created agents >
tentacle_port = <tentacle port, default: 41121>
tentacle_opts = < Tentacle client additional options >
data_dir = < (Only activated if the transfer_mode is local) Destination path for the XML of each agent, by default "/var/spool/pandora/data_in/" >

storage = < Enable with 1 to enable volume monitoring >
elastic_ip_address = < Enable with 1 to enable elastic IP address monitoring >
advance_monitoring = < Activate with 1 to enable widespread monitoring (these modules will only be created in the agents of the running instances) >
cpu_summary = < Enable with 1 to enable CPU monitoring >
iops_summary = < Enable with 1 to enable IOPS monitoring >
disk_summary = < Enable with 1 to enable disk monitoring >
network_summary = < Enable with 1 to enable network monitoring >

stats_agent = < Activate with 1 to enable a global agent that will monitor based on the task created and the parameters used >
stats_agent_name = < Name for the agent that is activated with the "stats_agent" parameter. If you do not use and "stats_agent" is enabled, the agent will be called "Aws" by default >

total_cost = < Activate with 1 to enable cost monitoring >
cost_regions = < List with the regions in which you want to monitor costs >

aws_regions = < List of regions to monitor (when you mark a region to monitor, it automatically monitors all buckets found within that region) >
aws_instances = < List with the id of the ec2 instances to monitor >

creds_b64 = < Base64 credentials in the JSON file to authenticate >
Example
agents_group_name  = Aws
interval           = 300
interval_cost      = 1 month
threads            = 4
transfer_mode      = tentacle
tentacle_ip        = 172.42.42.101
tentacle_port      = 41121
data_dir           = /var/spool/pandora/data_in/

storage            = 1
elastic_ip_address = 1
general_monitoring = 1
cpu_summary        = 1
iops_summary       = 1
disk_summary       = 1
network_summary    = 1

stats_agent        = 1
stats_agent_name   = AwsCloud

total_cost         = 1
cost_regions       = ["us-east-1","us-west-1"]

aws_regions        = ["us-east-1","us-east-2","us-west-1","us-west-2","ca-central-1","eu-central-1","eu-west-1","eu-west-2","eu-west-3","ap-northeast-1","ap-northeast-2","ap-southeast-1","ap-southeast-2","ap-south-1","sa-east-1"]
aws_instances      = ["i-0922a7a2ccc2168c1","i-0a5abff9200feb631"]

creds_b64          =  ewdhBDJDdvb2tleV9pZGdhjDNDHDhbdjdKKDNDbdBiwKInNlY3JldFSHSHHDGJCJChfDHCNCNHCdjdghDMDBGBkxlSLiIKfQ==
Manual execution
The plugin execution format is as follows:
./pandora_aws_ec2 --conf < path to configuration file >For example :
./pandora_aws_ec2 --conf /usr/share/pandora_server/util/plugin/aws_ec2.confThe execution will return an output in JSON format with information about the execution, and will generate an XML file for each monitored agent that will be sent to the Pandora FMS server by the transfer method indicated in the configuration.
For example:
{"summary": {"Total agents": 23, "Zones agents": 5, "Instances agents": 17}}
Discovery
This plugin can be integrated with Pandora FMS Discovery.
To do this, you must load the ".disco" package that you can download from the Pandora FMS library:
https://pandorafms.com/library/

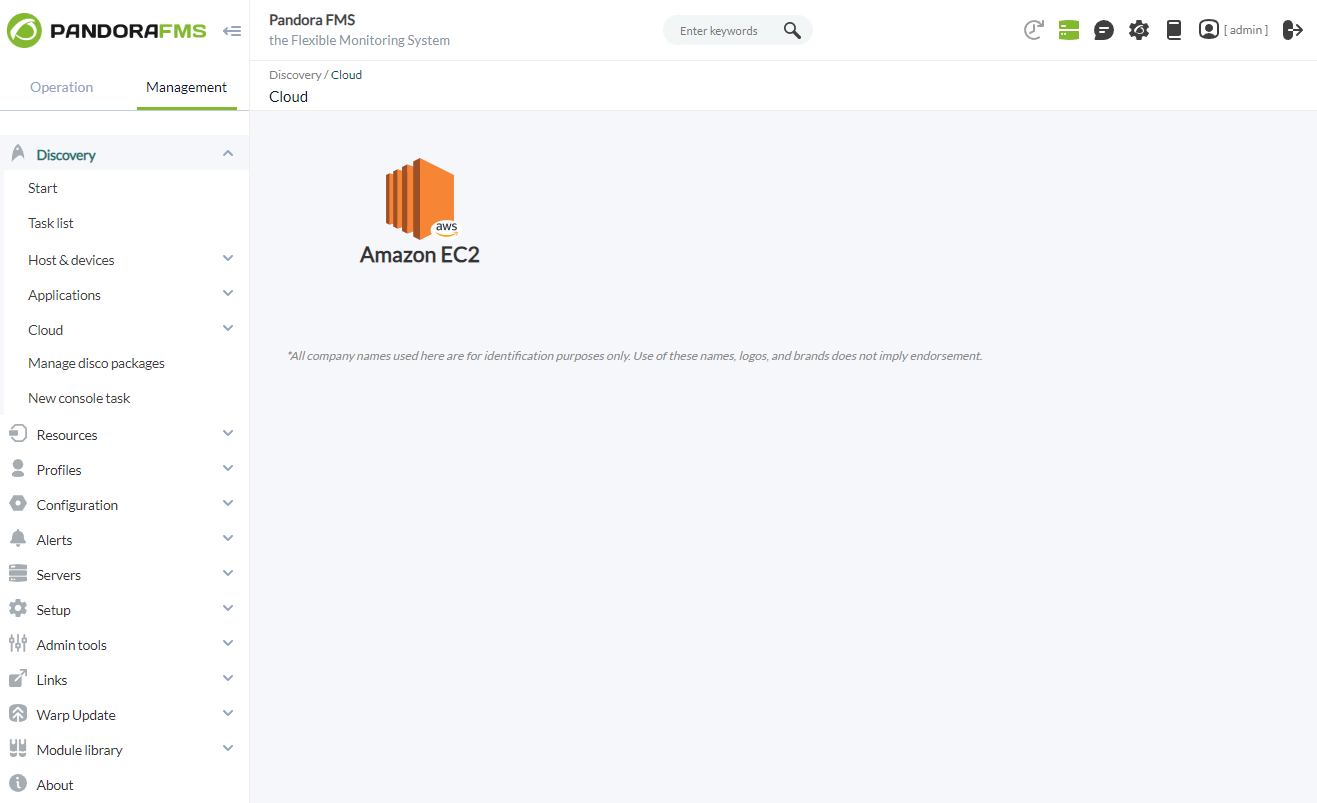
Once loaded, Amazon EC2 environments can be monitored by creating Discovery tasks from the Management > Discovery > Cloud section.
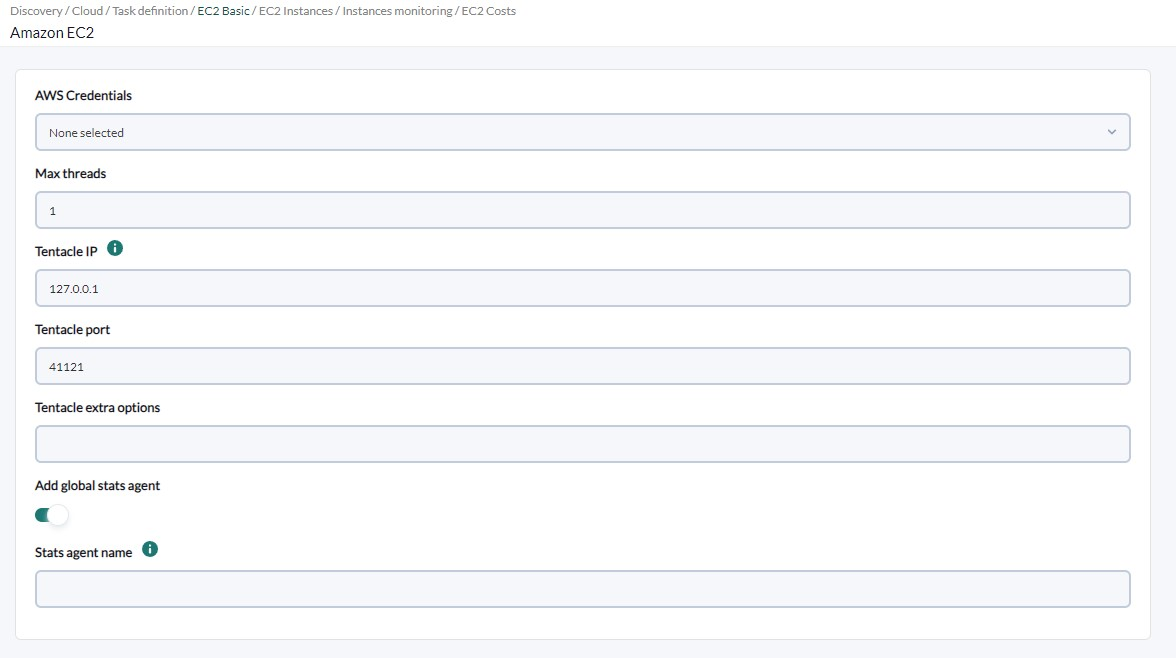
For each task, the following minimum data will be requested:
- AWS Credentials: Connection credentials to the AWS API to be used by the task. They must be previously registered in the Pandora FMS credential store.
- Max threads: To optimize the execution time, multiple threads can be configured to monitor the agents of the task. Keep in mind that setting up multiple threads can increase the CPU usage of the task.
- Tentacle IP – Tentacle server IP to send agent data to. Normally this parameter will not be modified.
- Tentacle port: Tentacle server port to send data to. Normally this parameter will not be modified.
- Tentacle extra options: Additional options for sending data through the Tentacle client. Normally this parameter will not be modified.
- Add global stats agent: If activated, a global agent will be generated with task statistics.
- Stats agent name: It will allow you to indicate the name of the agent for global statistics of the task. If no name is provided, the default name of the plugin will be used.
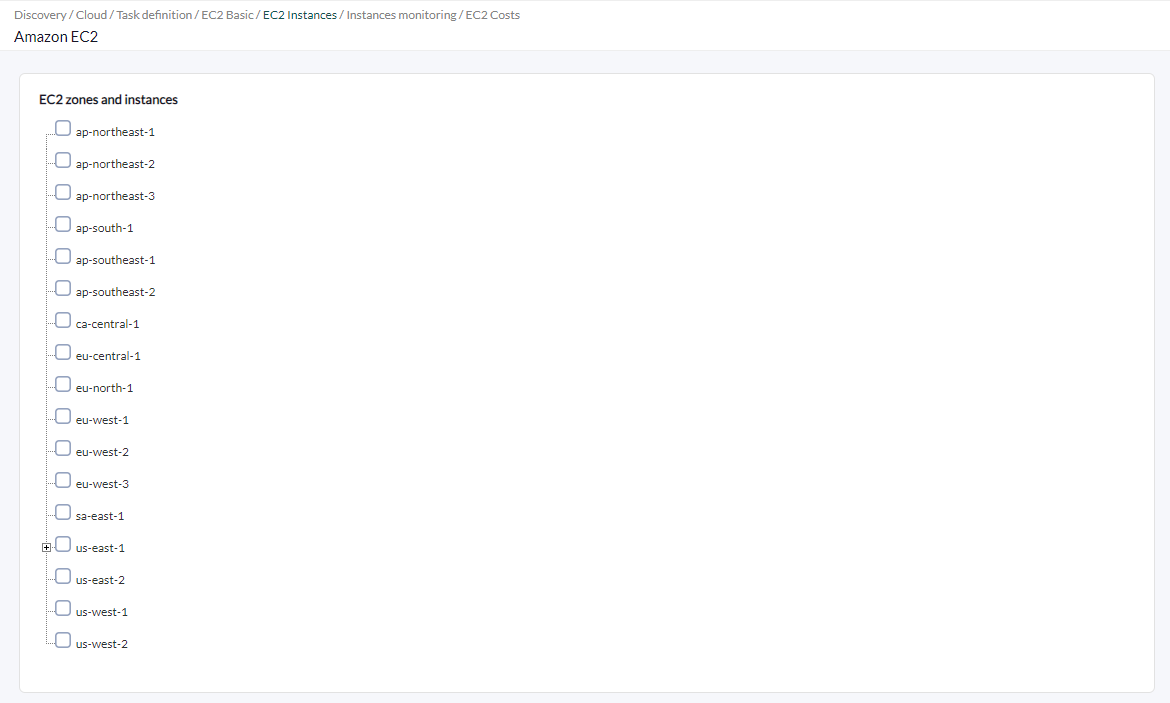
If the credentials provided are correct and the Pandora FMS server is able to connect to the AWS API, you will be able to see a tree with AWS EC2 zones and instances, which can be marked for monitoring.
If a zone is selected, in addition to the zone itself, all the instances it contains will be monitored (both at the time of configuring the task and later if new instances are included).
If specific instances are selected, they will be monitored regardless of whether their zones have not been selected.
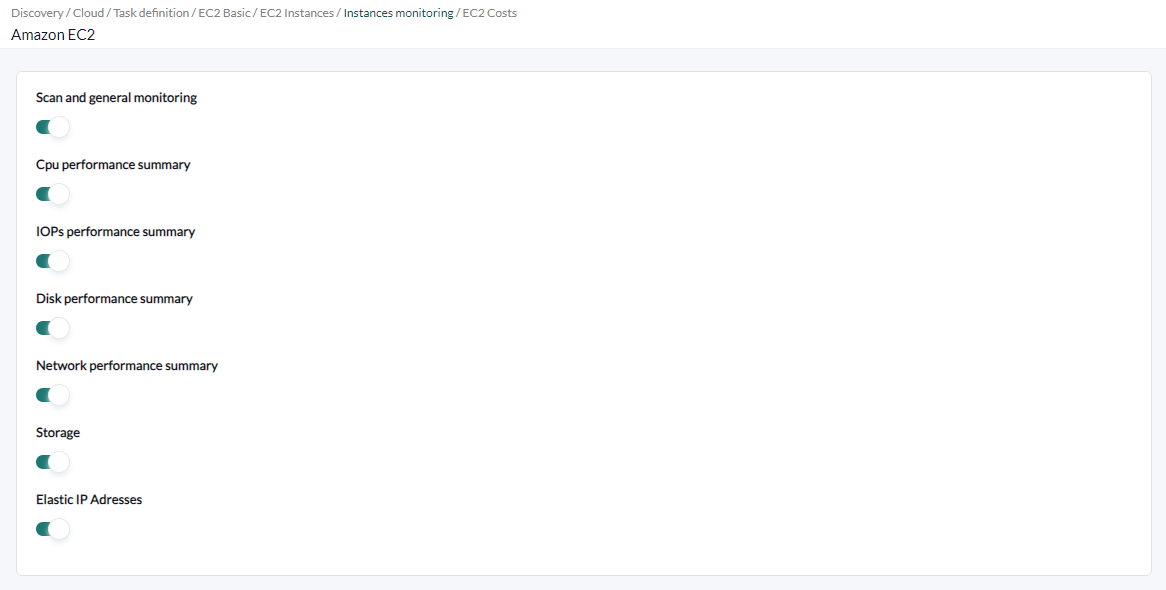
Next you can adjust the monitoring you want to obtain for each agent:
- Scan and general monitoring: If activated, the task will be enabled to obtain additional monitoring for the agents, described in the following fields.
- CPU performance summary: If activated, the CPU performance modules will be included in the monitoring.
- IOPs performance summary: If activated, the IOPs performance modules will be included in the monitoring.
- Disk performance summary: If enabled, the disk performance modules will be included in the monitoring.
- Network performance summary: If activated, the network performance modules will be included in the monitoring.
- Storage: If activated, the storage modules will be included in the monitoring.
- Elastic IP Addresses: If activated, the dynamic IP modules will be included in the monitoring.
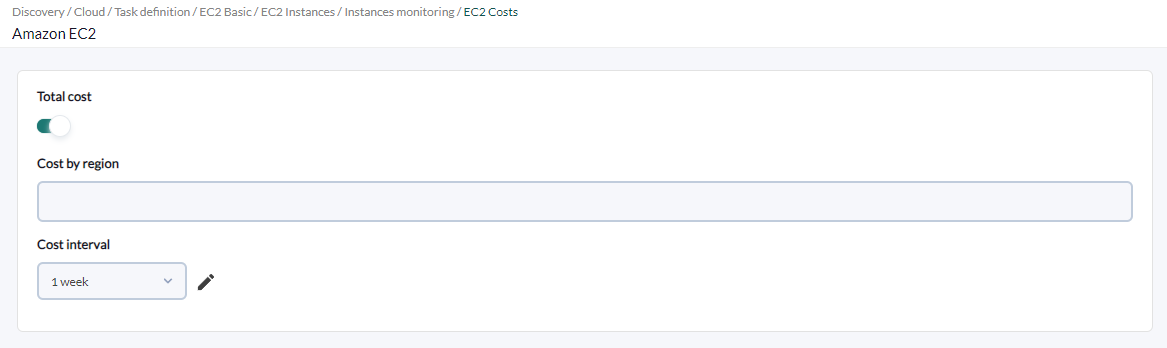
If the credentials provided are correct and the Pandora FMS server is able to connect to the AWS API, the costs by AWS region can be monitored by indicating the following data:
- Total cost: If activated, the task will be enabled to obtain cost monitoring, described in the following fields.
- Cost by region: List of AWS regions from which to obtain cost statistics.
- Cost interval: Time period from which to obtain cost statistics data for the indicated regions.
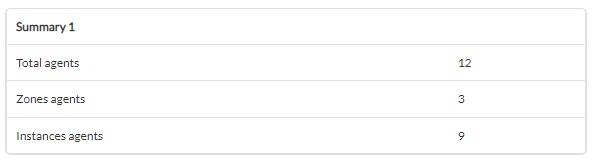
Tasks that are successfully completed will have an execution summary with the following information:
- Total agents: Total number of agents generated by the task.
- Zones agents: Total number of regions monitored by the task.
- Instances agents: Total number of instances monitored by the task.
The tasks that are not completed successfully will have an execution summary recording the errors produced.
Agents and modules generated by the plugin
Running the plugin will create the following agents and modules:
- Global agent
| < Name used with the parameter "stats_agent_name" or failing that "Aws" > |
Modules
|
AWS EC2 Total cost
|
Total Aws Costs |
|
AWS EC2 Instances count
|
Total instances registered in AWS |
- One agent for each monitored region.
| <Region name> |
Modules
| summary.aws.ec2.CPUUtilization | Average CPU percentage used for instances in this zone |
| summary.aws.ec2.DiskReadBytes | Summary of the number of bytes read from disk for each instance of this zone |
| summary.aws.ec2.DiskReadOps | Summary of the number of read operations performed on the disk of each instance of this zone |
| summary.aws.ec2.diskWriteBytes | Summary of the number of bytes written to disk for each instance of this zone |
| summary.aws.ec2.DiskWriteOps | Summary of the number of write operations performed on the disk for each instance in this zone |
| summary.aws.ec2.instances | Number of instances monitored in this zone |
| summary.aws.ec2.NetworkPacketsIn | Summary of the number of incoming network packets for each instance of this zone |
| summary.aws.ec2.NetworkPacketsOut | Summary of the number of outgoing network packets for each instance in this zone |
| cost | Total costs for the region |
|
summary.aws.ec2.storage.count
|
Number of volumes in the area |
| summary.aws.ec2.storage.size | Size in gigabytes of all volumes |
| summary.aws.ec2.addresses.count | Number of IPs |
- One agent for each monitored instance
| <instance ID> |
Modules
| State | Machine status, in string format |
| Instance State (bool) | Instance State (bool) State of the machine, 1 if it is running, 0 otherwise |
| CPUUtilization | Percentage of CPU utilization used |
| DiskReadBytes | Number of bytes read from disk |
| DiskReadOps | The number of read operations performed on the disk |
| DiskWriteBytes | Number of bytes written to disk |
| DiskWriteOps | Number of write operations performed on the disk |
| NetworkPacketsIn | The number of incoming network packets |
| NetworkPacketsOut | The number of outgoing network packets |