The agent will have the basic values of the operating system and will run a **Speed Test** *every half hour* and you will be ready to analyze the speed of internet link.
**What are we going to monitor in GNU/Linux?** We are going to see the values that are important to take into account in the health of an operating system which are:Disk usage percentage CPU wait time CPU usage Network usage Internet speed (Speed Test)
The internet speed measurement is done using the GNU/Linux client on the page [https:/ /www.speedtest.net/](https://www.speedtest.net/) a very reliable tool for this type of testing: [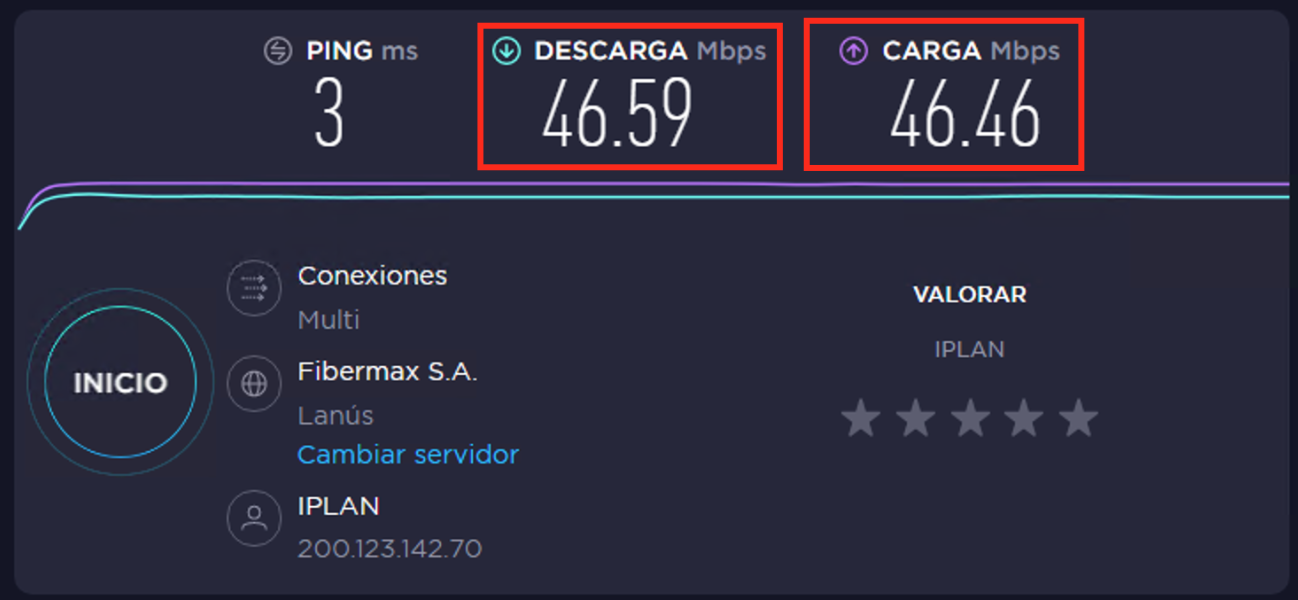](https://pandorafms.com/guides/public/uploads/images/gallery/2020-11/image-1604327078152.png) # Download and unzip the script The script is available for free in the Pandora FMS library, to download the script we execute the command: ```shell wget https://pandorafms.com/library/wp-content/uploads/2020/11/Install-PandoraAgent.tgz ``` Then we unzip the file with the command: ```shell tar xvzf Install-PandoraAgent.tgz ``` If everything worked correctly we see something similar to this: [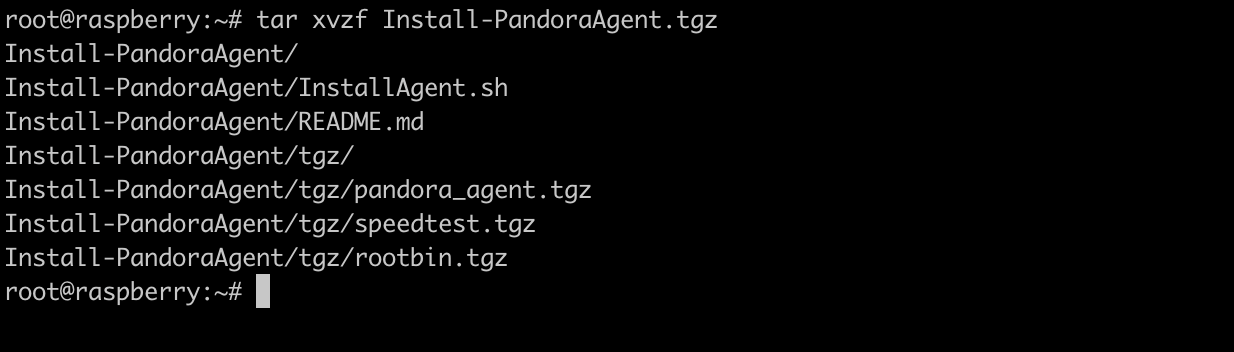](https://pandorafms.com/guides/public/uploads/images/gallery/2020-11/image-1604193211737.png) # Run script**The script supports the following Linux distributions: CentOS 7, CentOS 8, Debian 9.x or later, Ubuntu 18.x or later, Raspbian 9.x and Raspberry OS 10.x.**
**An internet connection is required since the agent is downloaded as part of the process**
We enter the agent directory and then execute it with the following command: > **./Install\_agent.sh \[server\]** A practical example would be: **./Install\_agent.sh 192.168.110.20,** where the IP address 192.168.110.20 corresponds to our **Pandora FMS** server. The script automatically detects which is the Linux distribution. In this guide we will see the example with a Raspberry PI, but we will obtain a similar result in any of the distributions supported by the same We see the execution example: [](https://pandorafms.com/guides/public/uploads/images/gallery/2020-11/image-1604193593648.png) We wait for the script to finish executing, it takes a few minutes depending on the internet connection we have to carry out the process: [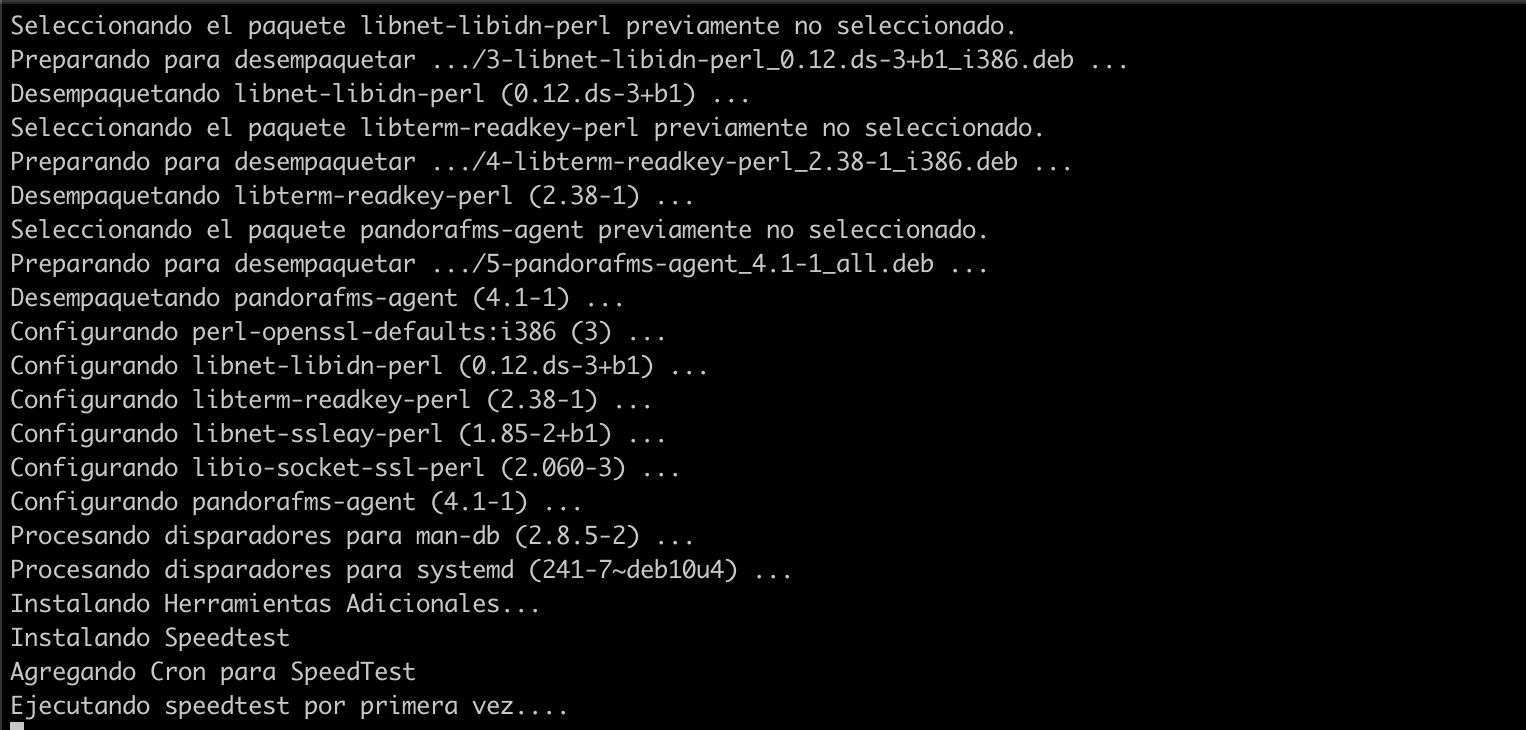](https://pandorafms.com/guides/public/uploads/images/gallery/2020-11/image-1604193682897.png) [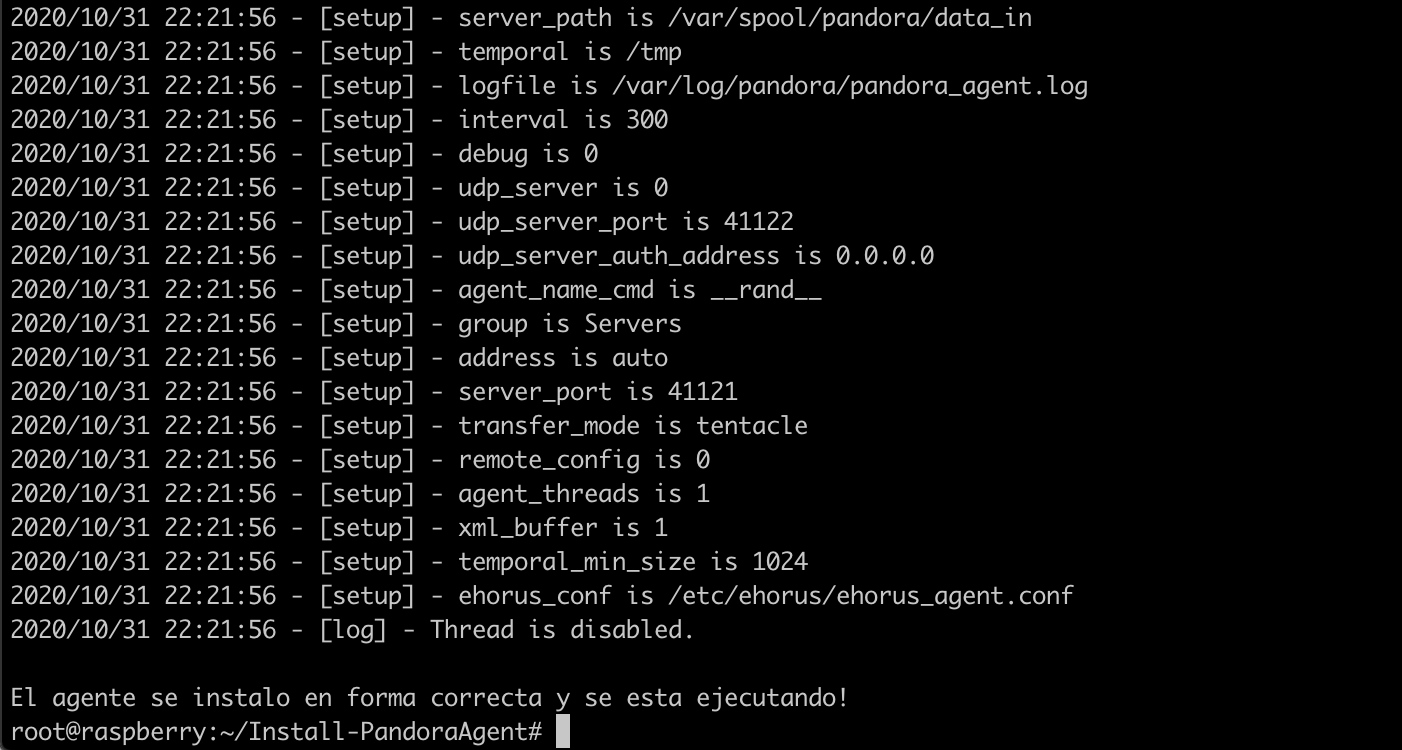](https://pandorafms.com/guides/public/uploads/images/gallery/2020-11/image-1604194323764.png) # Agents in the WEB console We see the agents created with this script [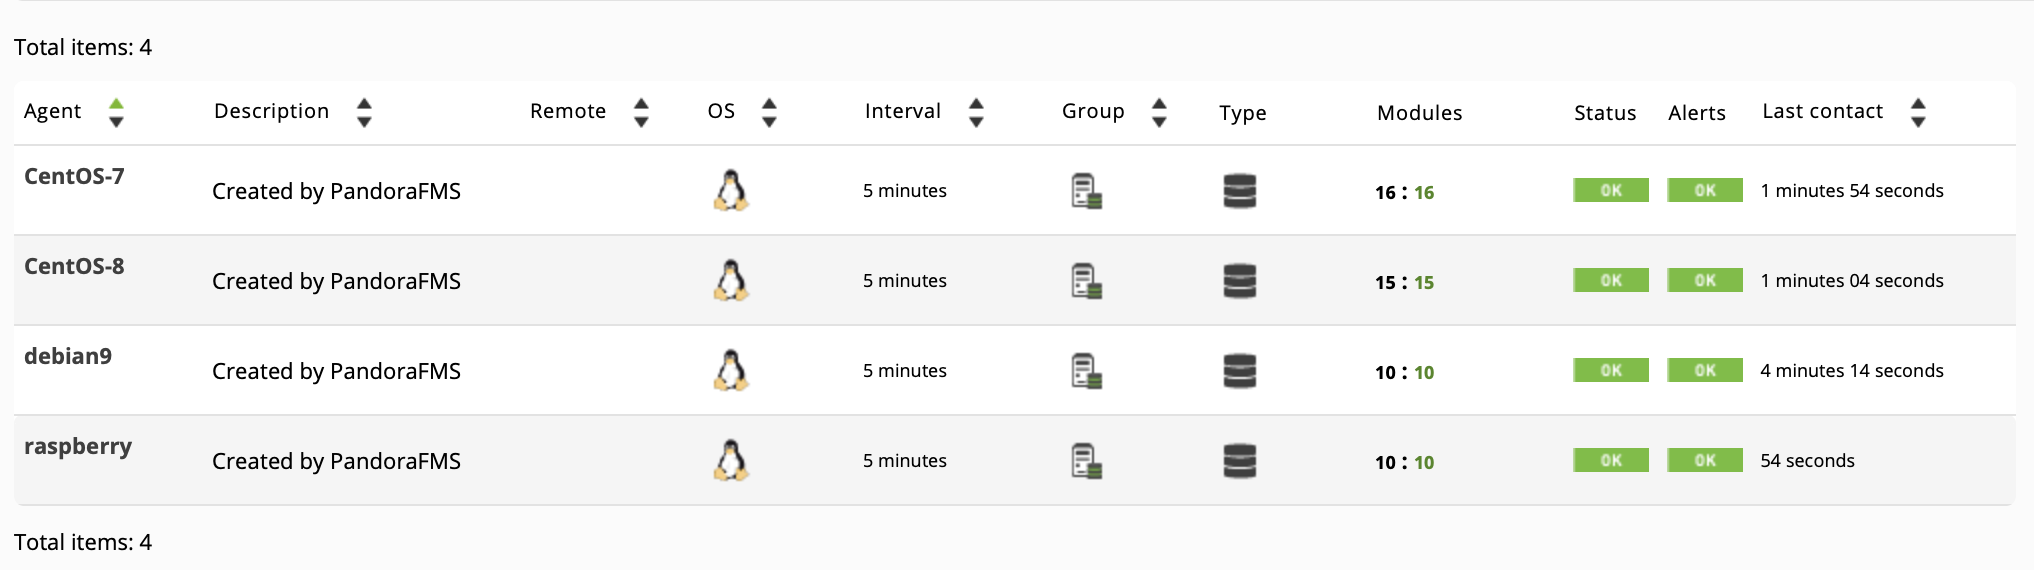](https://pandorafms.com/guides/public/uploads/images/gallery/2020-11/image-1604194672085.png) [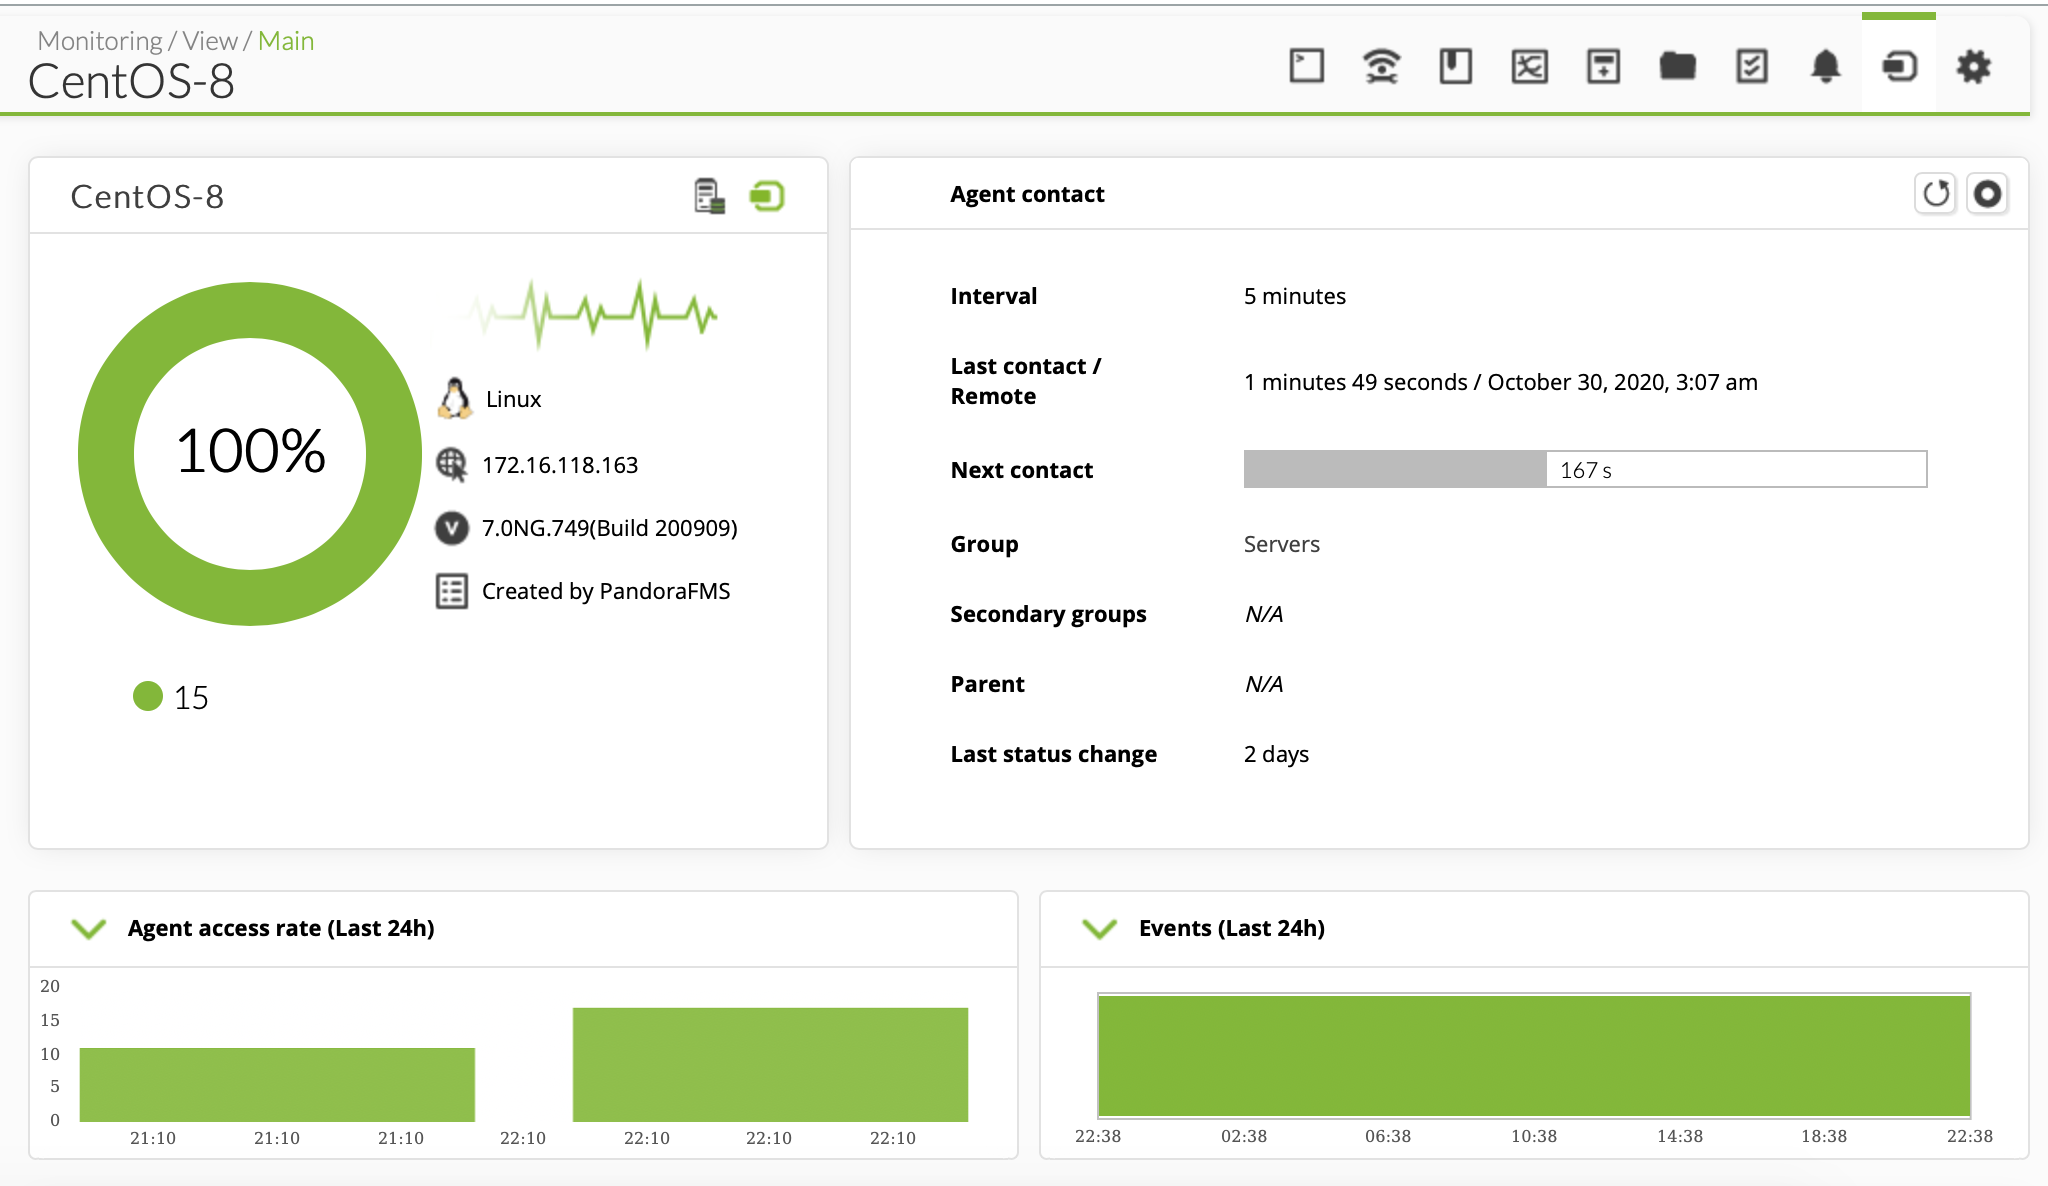](https://pandorafms.com/guides/public/uploads/images/gallery/2020-11/image-1604194722737.png) 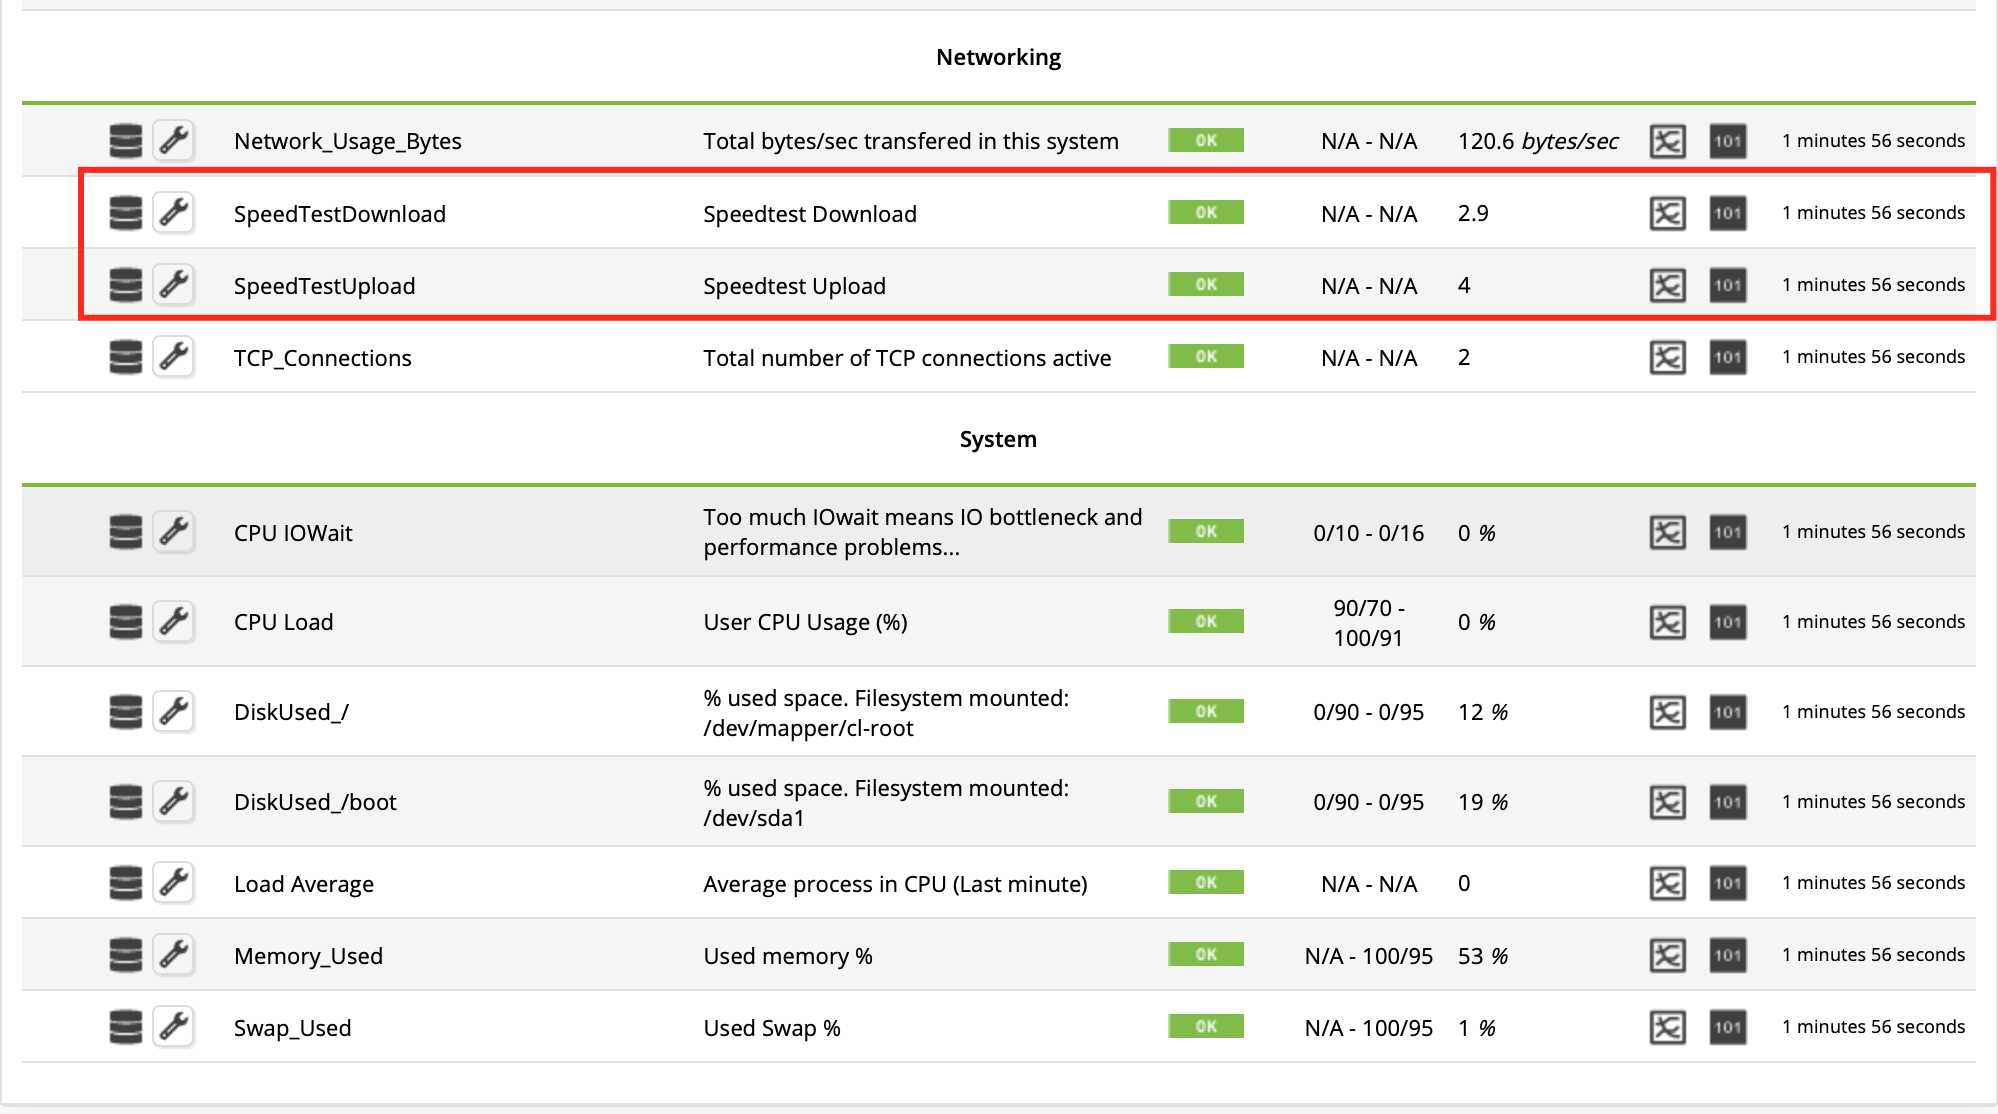**In red you can see the values of the Speed Test executed on an agent with CentOS 8 (the measurement is expressed in MB/sec)** # How Speed Test works We already have the script installed, now we are going to see how it works to understand and learn more about how **Pandora FMS** works. When you run the installer, the **/root/bin** folder is created (in case it does not exist), inside this folder we will find several scripts: [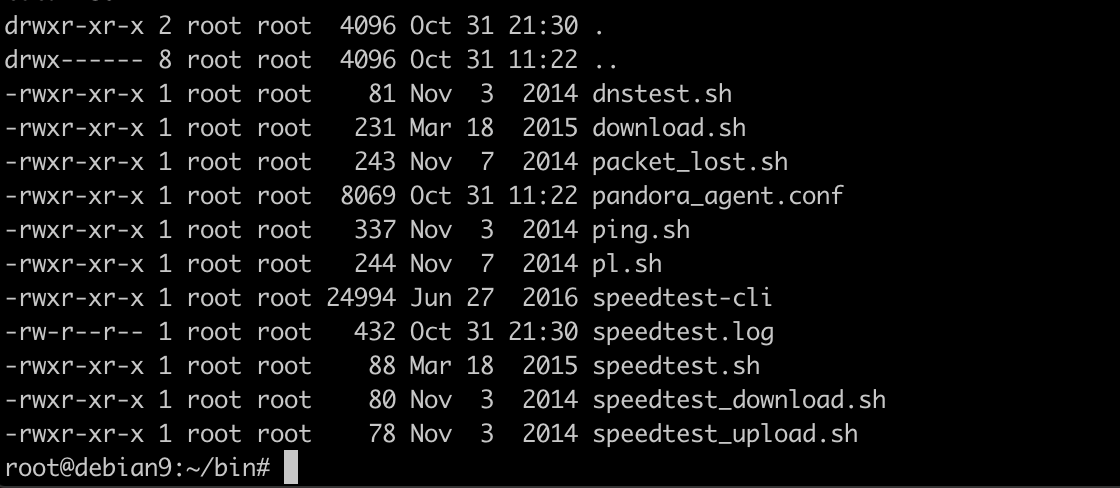](https://pandorafms.com/guides/public/uploads/images/gallery/2020-11/image-1604322344832.png) The **pandora\_agent.conf** file (it is the initial version created by the script when installing), regarding the operation of the Speed Test tool, the client in Python is used which is the **speedtest-cli file,** so that the metrics can be taken, a scheduled task is created that executes the script **/bin/speedtest.sh** which is executed once every half hour, you can validate it with the command ```shell crontab -l ``` [](https://pandorafms.com/guides/public/uploads/images/gallery/2020-11/image-1604322553252.png) It generates a file **speedtest.log**, where the **PandoraFMS** agent takes the metrics [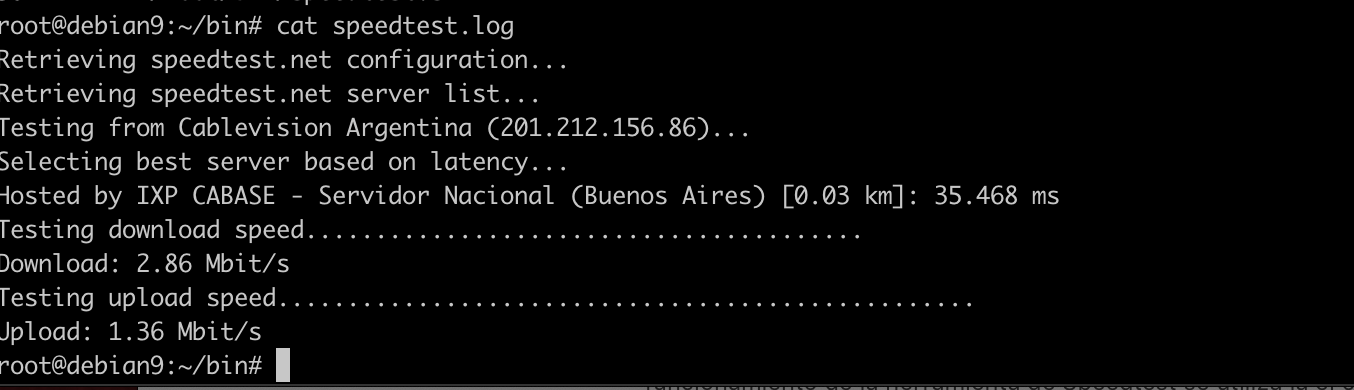](https://pandorafms.com/guides/public/uploads/images/gallery/2020-11/image-1604322608558.png) The scripts **speedtest\_upload.sh** and **speedtest\_download.sh** are the ones that take the values to be able to add them in **Pandora FMS:** [ 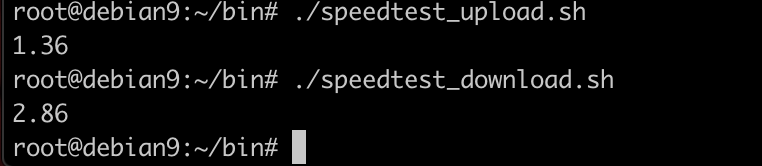](https://pandorafms.com/guides/public/uploads/images/gallery/2020-11/image-1604322701348.png) To finish the lines corresponding to the internet speed tests in our configuration file **pandora\_agent.conf** are the following: ```shell # SpeedTest Download module_begin module_name SpeedTestDownload module_type generic_data module_description Speedtest Download module_exec /root/bin/speedtest_download.sh module_group Networking module_end # Ping SpeedTest Upload module_begin module_name SpeedTestUpload module_type generic_data module_description Speedtest Upload module_exec /root/bin/speedtest_upload.sh module_group Networking module_end ``` # Additional monitors When installing the agent automatically, some very useful scripts were added that are not part of the automated installation but can be used simply by adding some lines to the **pandora\_agent.conf** file. > as we can see in the following examples Ping to an IP, for the example we are going to use Google DNS 8.8.8.8, for it to work it will be Just add the following lines **(use the script /root/bin/ping.sh)** ```shell ## Google DNS Ping module_begin module_name Ping-DNS-Google module_type generic_data module_description Ping DNS Google module_max_critical 1 module_exec /root/bin/ping.sh 8.8.8.8 module_group Networking module_end ``` [](https://pandorafms.com/guides/public/uploads/images/gallery/2020-11/image-1604325679286.png)**Example Ping to Switch 192.168.10.10** In order to measure the number of packets lost to an IP address, for example, Google DNS 8.8.8.8 will be It is enough to add the following lines **(use the script /root/bin/pl.sh)** ```shell ## Packet loss to DNS Google 8.8.8.8 module_begin module_namePercentLostPackagesDNSGoogle module_type generic_data module_description Percent Lost DNS Packets Google 8.8.8.8 module_exec /root/bin/pl.sh 10 8.8.8.8 module_group Networking module_end ``` [](https://pandorafms.com/guides/public/uploads/images/gallery/2020-11/image-1604325567410.png) **Example testing google.com.ar** To complete the monitors that are useful to know the health of our internet link with the following lines we can measure the network latency to an IP address, it is interesting to use the same one as in ping from the previous step: ```shell ## Network Latency module_begin module_name PingLatencyGoogleDNS module_type generic_data module_description PingLatencyDNSGoogle module_exec ping 8.8.8.8 -c 3 | grep "rtt min" | awk '{ print $4 }' | cut -f 2 -d "/" module_group Networking module_end ``` [ ](https://pandorafms.com/guides/public/uploads/images/gallery/2020-11/image-1604326203872.png) **Google.com Latency Example**