Apache Spark plugin
Plugin to grab metrics from all executors of all running or finished apps on your Spark server.
- Introduction
- Compatibility matrix
- Prerequisites
- Configuration
- Plugin general parameters
- Plugin specific parameters
- Configuration in Pandora
- Modules generated
Introduction
Ver. 03-09-2021
Plugin to grab metrics from all executors of all running or finished apps on your Spark server.
Compatibility matrix
| Systems where it has been tested |
CentOS 7, Fedora |
| Systems where it should work |
Any linux system |
Prerequisites
Required:
- A Spark server
- Spark history server enabled
- Pandora FMS Data Server enabled
- Have the Pandora FMS Plugin Server enabled
Configuration
The plugin makes use of some Spark rest api endpoints, in order to access them from the plugin we will have to have a series of active ports that are not blocked by the firewall, these are the following :
firewall-cmd --permanent --zone=public --add-port=6066/tcp
firewall-cmd --permanent --zone=public --add-port=7077/tcp
firewall-cmd --permanent --zone=public --add-port=8080-8081/tcp
firewall-cmd --permanent --zone=public --add-port=4040/tcp
firewall-cmd --permanent --zone=public --add-port=18080/tcp
firewall-cmd --reload6066: Rest url (cluster mode).
7077: Server master.
8080 : Web UI.
4040: For running applications.
18080: For the history server.
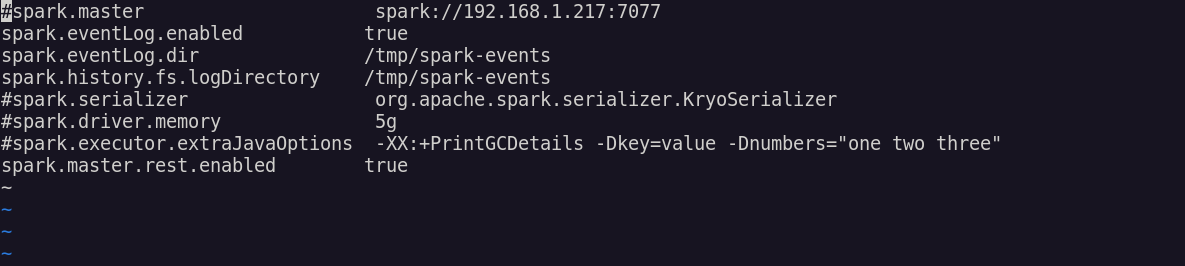
In order to make use of the history server we will have to enable spark.eventLog.enabled, spark.eventLog.dir and spark.history.fs.logDirectory in spark-defaults.conf.
You can find a conf template in /conf
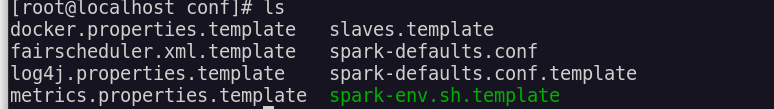
We will create in that path the file with:
vi spark-defaults.confAnd we'll leave it at that, you can choose the path where you want to save the events.
Now we can activate the history server, in /sbin, the same path where the master, workers, etc. are activated.

We will start it with :
./start-history-server.sh
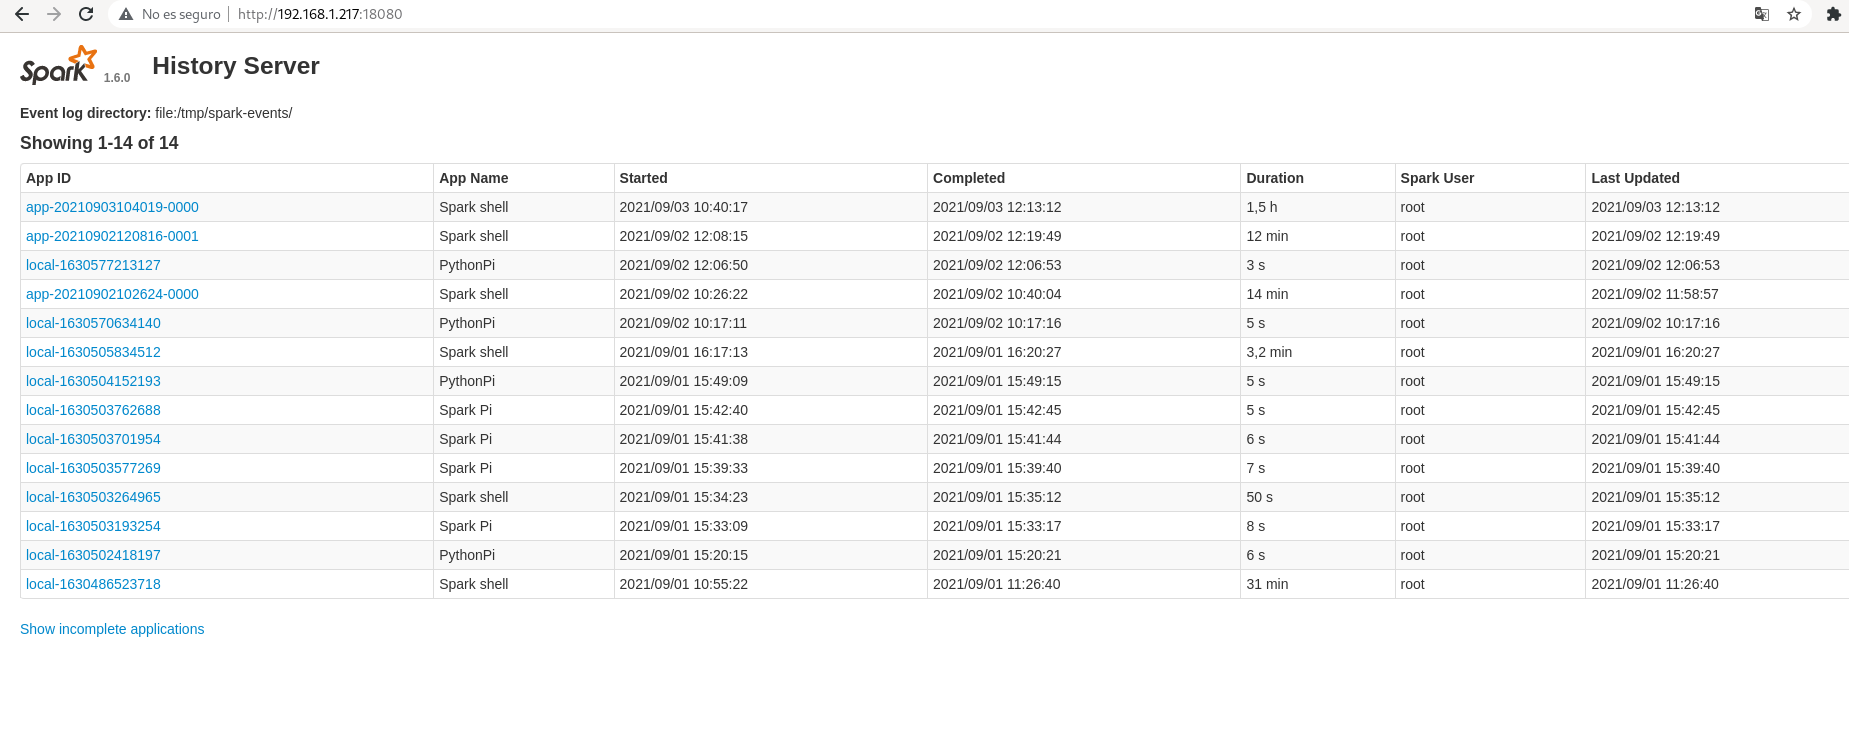
If we go to the log that returns the output we will see how correctly it has been started and its url.
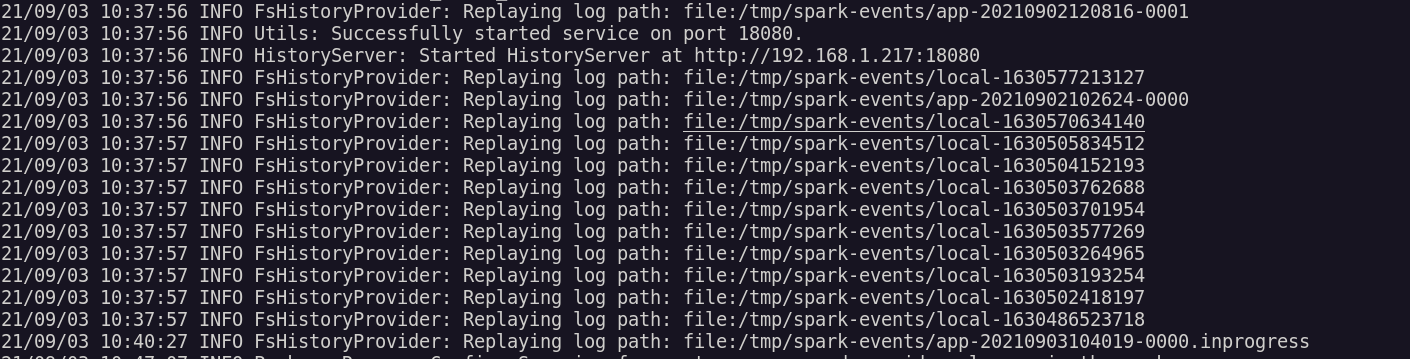
If we access the url we will see the history server.
Note:
This is assumed, but for the plugin to work you will need to have the master server active, as well as have applications running or that have been run and have finished, as it is from the applications that we will take the metrics, specifically from their runners.
Plugin general parameters
./pandora_spark -i <ip-with-port> -[ -g <group> ] [ --data_dir <data dir> ] If the execution is correct we will see a 1.

If you want to get the data from running applications, enter the ip with port 4040, if you want to get the data from finished applications enter port 18080.
Plugin specific parameters
The plugin has the following parameters:
| Parameter | Description |
| -i <ip-with-port> --ip <ip-with-port> | ip with port, mandatory. |
| -g GROUP, --group GROUP | Pandora FMS target group (optional) |
| --data_dir DATA_DIR | Pandora FMS data directory. By default it is /var/spool/pandora/data_in/ (optional) |
Help example:

Configuration in Pandora
Installation from the console
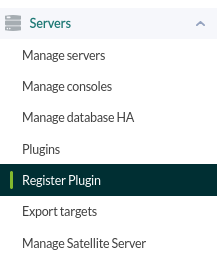
To register the plugin, from the console, go to the "register plugin" section.
Click on select file.
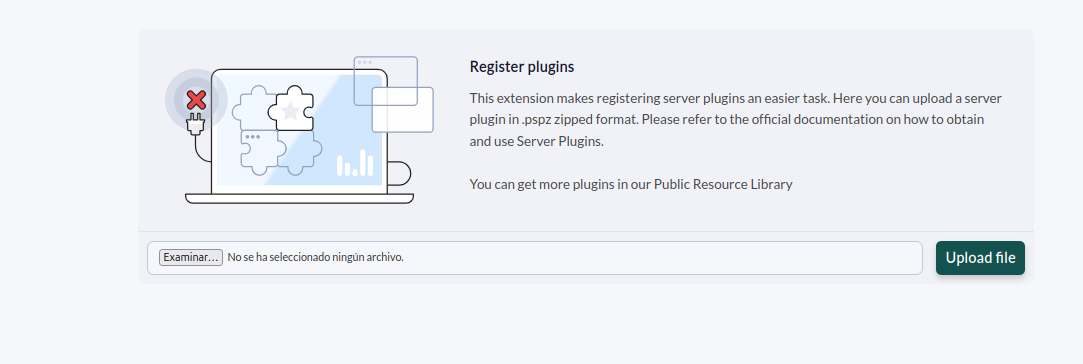
Select the .pspz2 file containing the plugin.

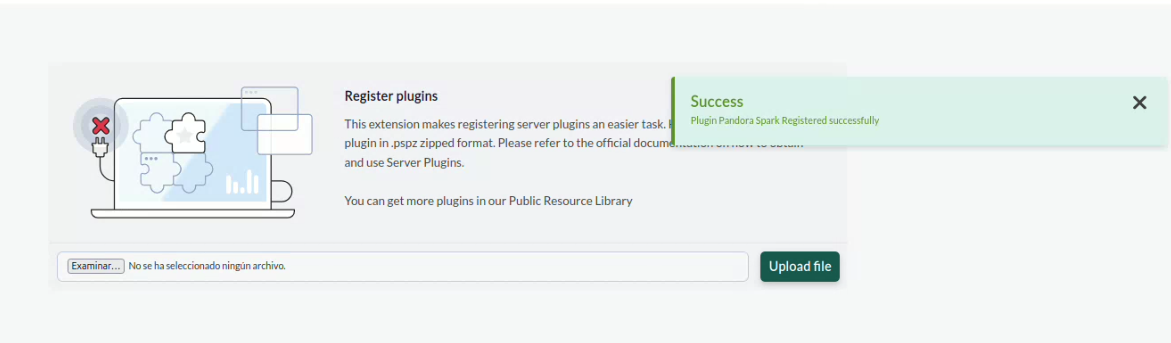
Once uploaded, a message will be displayed indicating that it has been successfully uploaded.
Once the plugin is registered, we will see it in the plugins section.
In the parameters section, all the parameters contained in the plugin will be displayed, although it is only mandatory to use the ip parameter.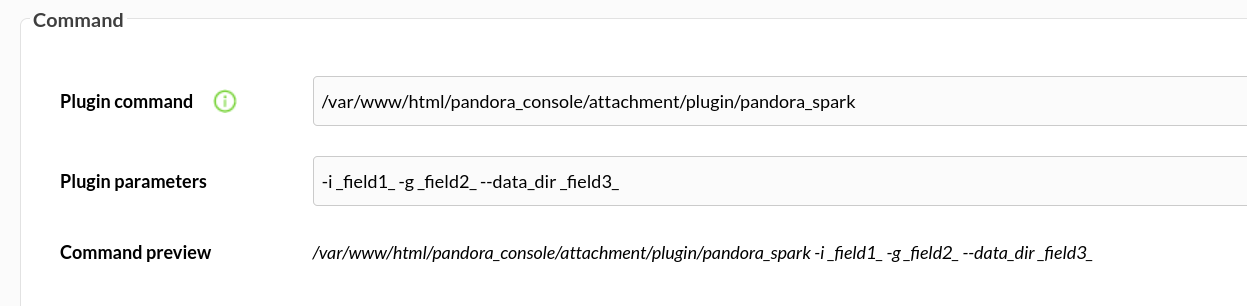
Below we can assign the required value to each macro.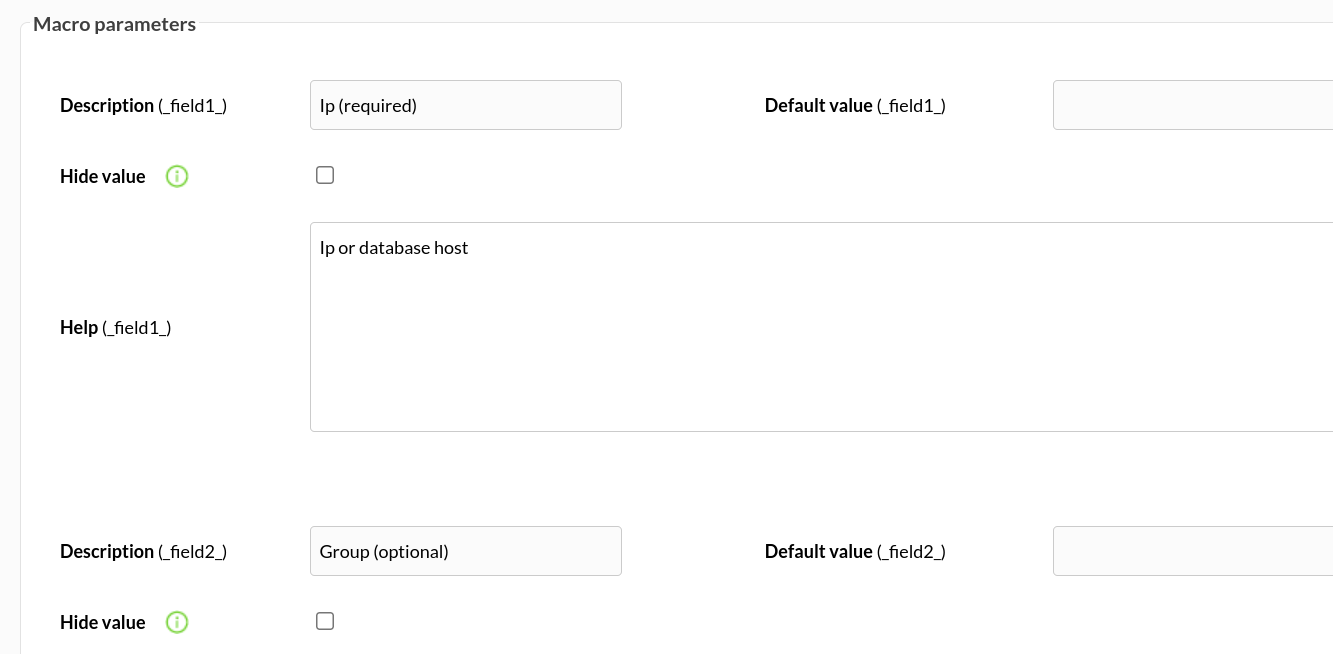
The best way to manage server plugins in Pandora is from "/usr/share/pandora_server/util/plugin" so we will send it to that path.
Then we will move to the folder where we have put it ("/usr/share/pandora_server/util/plugin" is the recommended one").
Remember: You have to install the dependencies that the Requests module needs in your system, it is explained in the configuration section.
We move from home with :
cd /usr/share/pandora_server/util/plugin/We run the plugin to see that it works:
./pandora_spark -i <ip-with-port> -[ -g <group> ] [ --data_dir <data dir> ]
As a server plugin
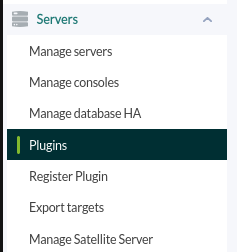
Go to servers > plugins:
Click in add:

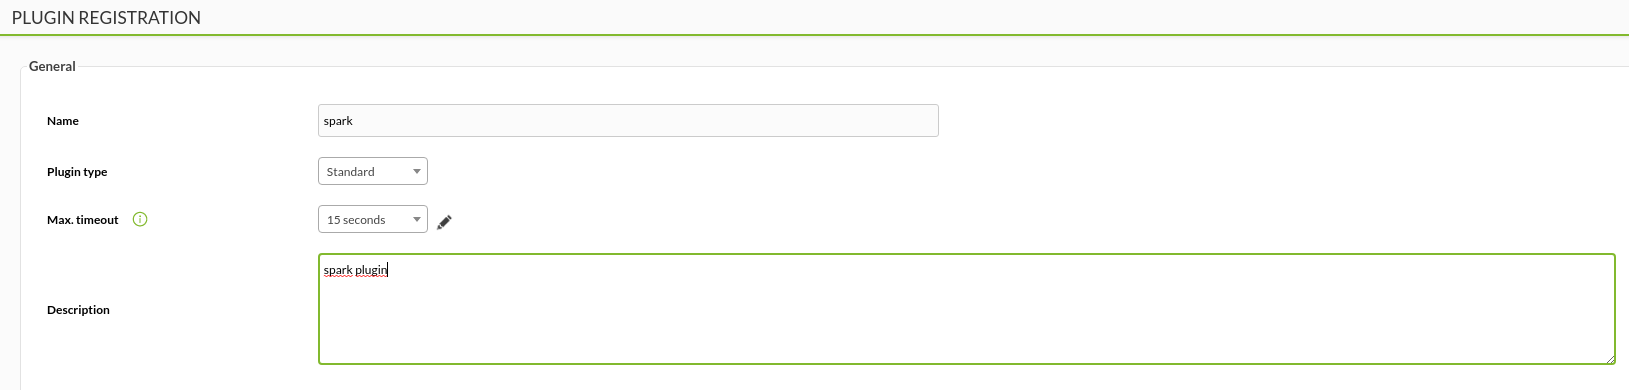
We put in the name and description of your choice:
We enter the path to the plugin as a command, and as parameters we will configure the “_field_” fields, which are macros that we will define below.

We put for each macro the description that you prefer and as value the data of your ip.

Once this is done, if we execute the plugin from the terminal, the agent with the modules will have been created.
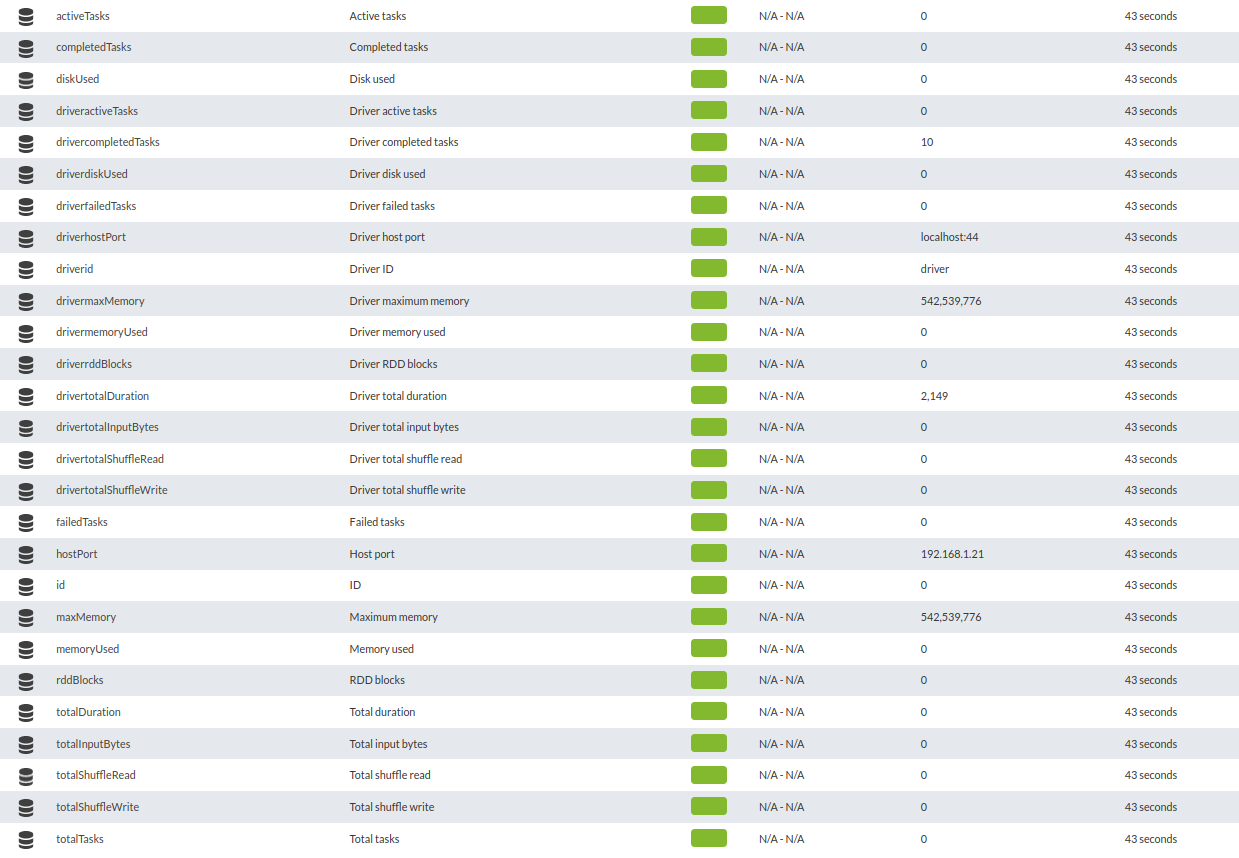
Modules generated
An agent will be created for each application of our server with data of all its executors, the name of each module will be composed of the id of the executor plus its function.
Ejecutors modules
| Nombre del módulo |
| id |
| hostPort |
| rddBlocks |
| memoryUsed |
| diskUsed |
| activeTasks |
| failedTasks |
| completedTasks |
| totalTasks |
| totalDuration |
| totalInputBytes |
| totalShuffleRead |
| totalShuffleWrite |
| maxMemory |