
Welcome to Pandora FMS Community › Forums › Community support › Graphs not showing in ‘default’ critical email alert
-
Graphs not showing in ‘default’ critical email alert
Posted by dynamicl on September 13, 2017 at 23:10Just getting the dreaded red x in a box where the image is supposed to be.
No changes have been made to the standard ’email to admin’ template. Red alarm image shows up fine, so pretty sure its not an outlook issue.
I can see the template is using this tag at the bottom ‘_modulegraph_24h_’
… and the email source when it arrives shows this …
Hope you can help,
Thanks
Jose replied 1 year, 7 months ago 7 Members · 9 Replies -
9 Replies
-
 ::
::Hi dynamicl,
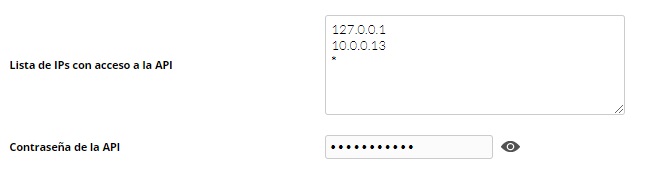
You have to go to the Pandora configuration, set the password and the allowed IP addresses.


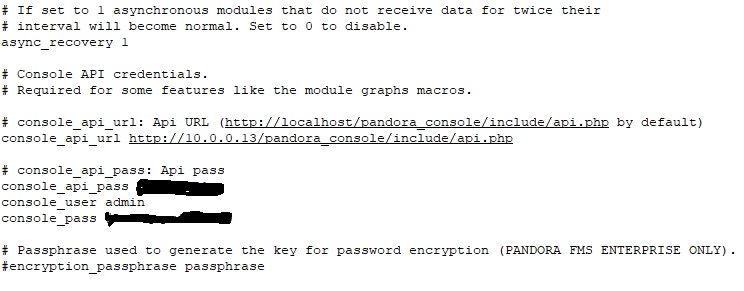
Then you need modify the configuration file of the pandora server and uncomment these lines.
# console_api_pass: Api pass
console_api_pass apipass

# console_user: Console user name (admin by default)
console_user admin
Check if you can see the graph in the email.
Best regards,
vic.
-
-
::
Hi dynamicl,
You have to go to the Pandora configuration, set the password and the allowed IP addresses.
Then you need modify the configuration file of the pandora server and uncomment these lines.
# console_api_pass: Api pass
console_api_pass apipass

# console_user: Console user name (admin by default)
console_user admin
Check if you can see the graph in the email.
Best regards,
vic.
I must be missing something here.
I’ve updated my password via the gui, I just set as ‘apipass’ to test, and updated access to be 127.0.0.1 and *. Then updated my pandora_server.conf to be the below.
console_api_url http://localhost/pandora_console/include/api.php
console_api_pass apipass
console_user admin
It sends out email via gmail and when i open it there i get no graphs. Is it because I’m doing it via gmail?
Thanks
Good morning idic,
What version of Pandora FMS do you have installed?
Alberto
-
-
::
I am running Pandora FMS v7.0NG.731 – Build PC190130 – MR 24
Greetings, idic
What graph are you trying to generate? A pdf or an alert related one? If its the second case, you’ll need a console_pass parameter following the previous three.
console_api_url http://localhost/pandora_console/include/api.php
console_api_pass apipass
console_user admin
console_pass userpass
You’ll have to notice too that your url can’t be localhost, you’ll have to provide the IP.
Regards,
Eduardo.
-
-
::
Hi,
I’m newbie in this software, I configured it and works fine, but I receive only a part of the graph.I’m trying to send the _modulegraph24_.
I configured all the things that you say:
console_api_url http://10.0.0.13/pandora_console/include/api.php
# console_api_pass: Api pass
console_api_pass *******
console_user admin
console_pass ******And I put the same api_pass in gui enviroment.
Can you help me?
Thnaks in advance
Joan

-


